> ## Documentation Index
> Fetch the complete documentation index at: https://docs.pingtree.com/llms.txt
> Use this file to discover all available pages before exploring further.
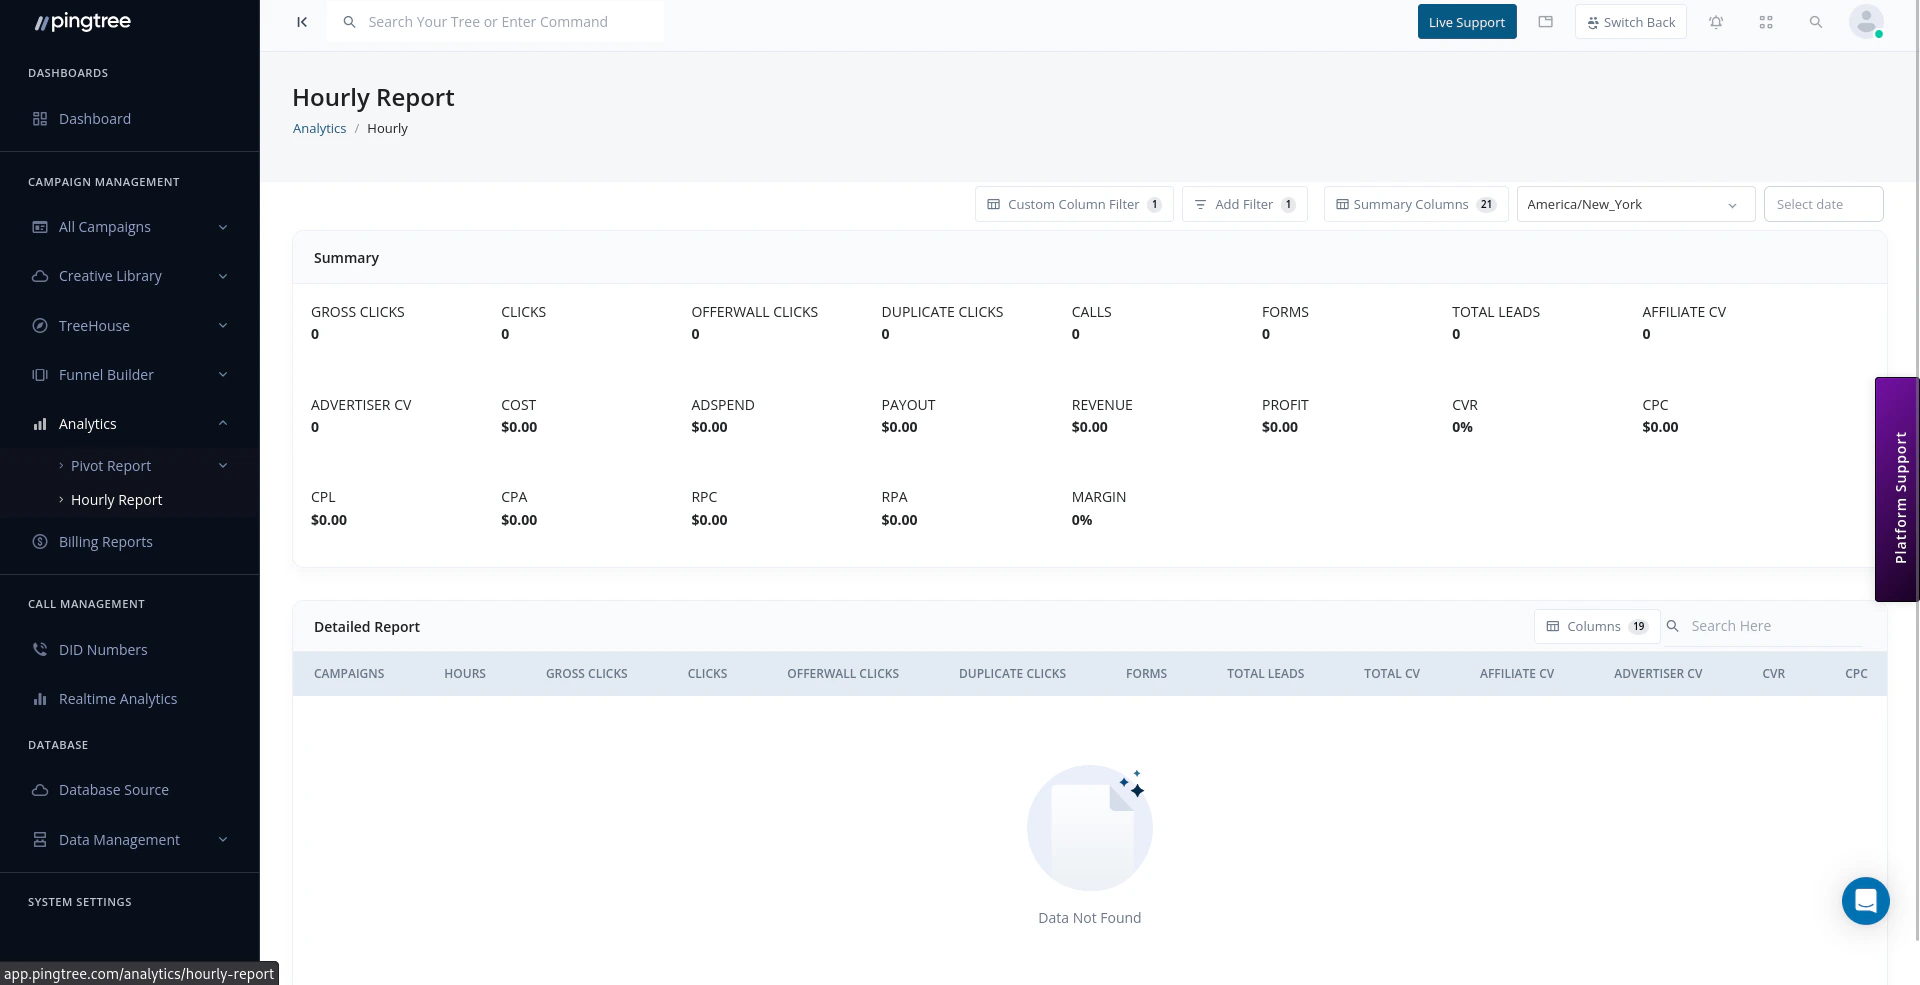
# Hourly Report
> Monitor and analyze campaign activity in Pingtree (PT) on an hourly basis for any specific day.
The **Hourly Report** in **Pingtree (PT)** allows users to monitor and filter campaign performance data on an **hour-by-hour** basis for any selected day. This is useful for analyzing trends, identifying performance spikes, and optimizing campaign timing.
 ***
## Overview
With the Hourly Report feature, users can:
* View campaign performance segmented by each hour of a selected day
* Apply multi-dimensional filters
* Customize the visible data using column selectors
***
## Overview
With the Hourly Report feature, users can:
* View campaign performance segmented by each hour of a selected day
* Apply multi-dimensional filters
* Customize the visible data using column selectors
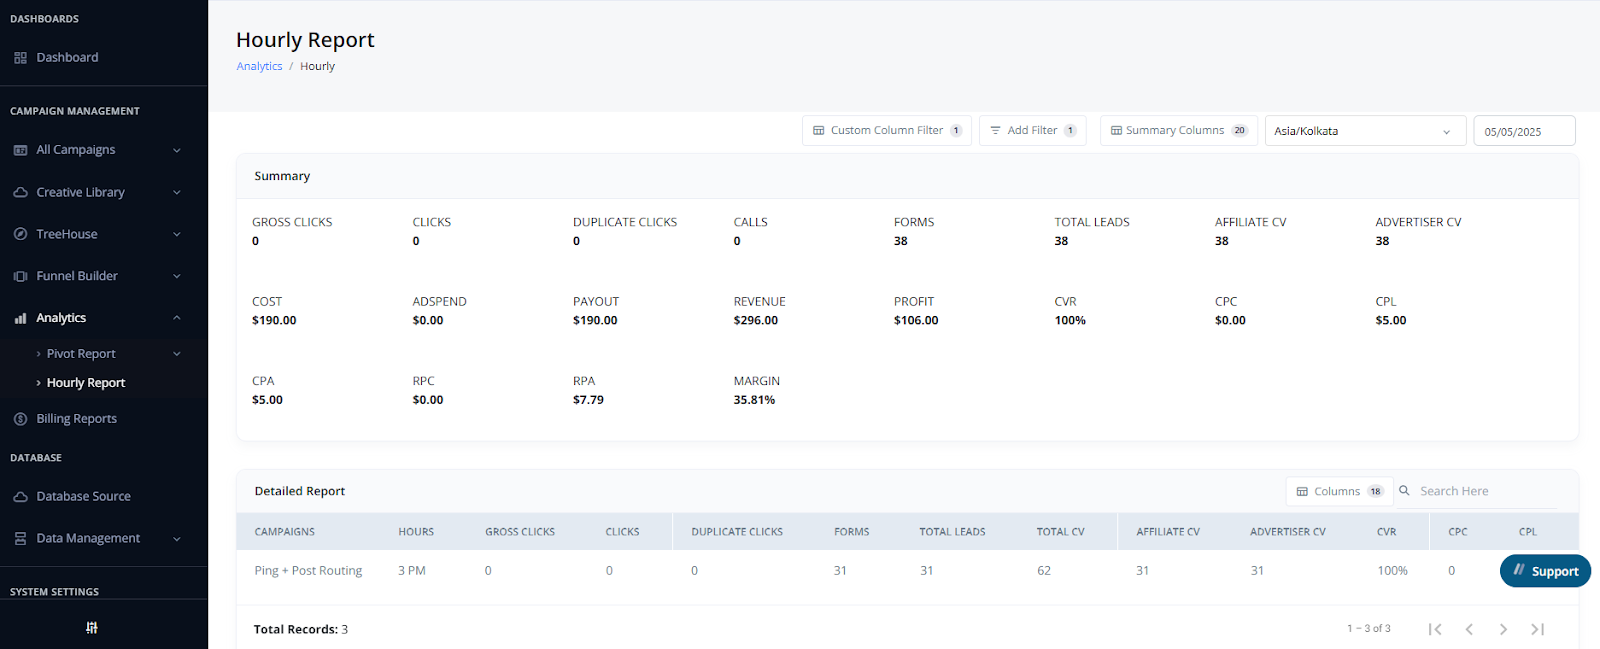 ***
## Key Features
### Add/Remove Table Columns
* Click the **column selector** icon to open the column manager.
* **Show or hide** specific metrics depending on what data you want to analyze.
* Customize the data view to match your team’s reporting needs.
***
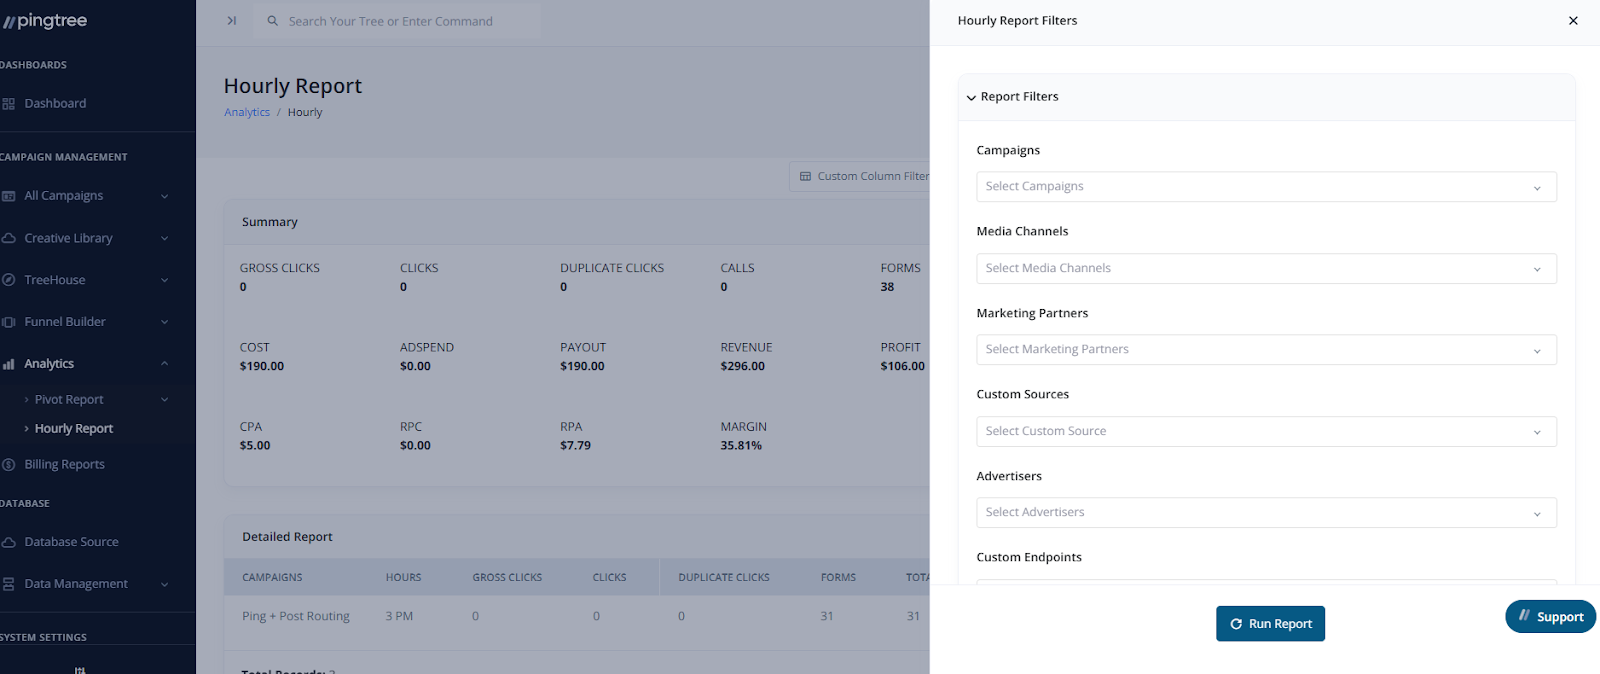
### Multi-Level Filtering
Apply filters across several dimensions to focus your view:
* **Campaigns**
* **Traffic Sources**
* **Advertisers**
* **Endpoints**
* **Media Types**
* And more...
You can filter by **individual** or **multiple** values in each category.
***
## Key Features
### Add/Remove Table Columns
* Click the **column selector** icon to open the column manager.
* **Show or hide** specific metrics depending on what data you want to analyze.
* Customize the data view to match your team’s reporting needs.
***
### Multi-Level Filtering
Apply filters across several dimensions to focus your view:
* **Campaigns**
* **Traffic Sources**
* **Advertisers**
* **Endpoints**
* **Media Types**
* And more...
You can filter by **individual** or **multiple** values in each category.
 ***
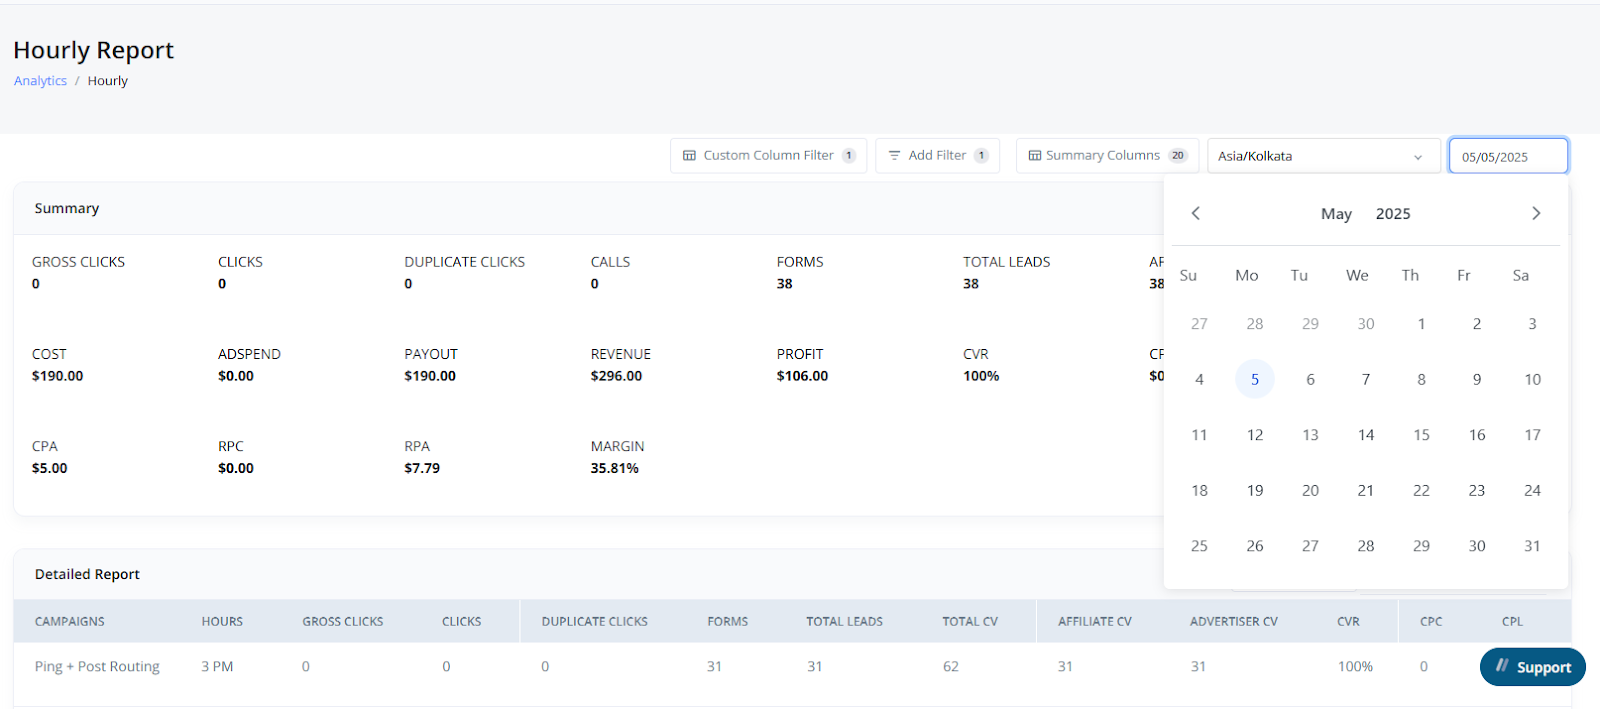
### Date Selection
* Use the **Date Picker** to choose the specific day you want to review.
* All data shown in the report corresponds to the selected date.
* Hours are displayed in the selected **timezone**.
***
### Date Selection
* Use the **Date Picker** to choose the specific day you want to review.
* All data shown in the report corresponds to the selected date.
* Hours are displayed in the selected **timezone**.
 ***
## Navigation Path
To access the Hourly Report:
> **Left Sidebar → Analytics → Hourly Report**
From there, select your filters and columns to generate your customized hourly performance view.
***
## Navigation Path
To access the Hourly Report:
> **Left Sidebar → Analytics → Hourly Report**
From there, select your filters and columns to generate your customized hourly performance view.