> ## Documentation Index
> Fetch the complete documentation index at: https://docs.pingtree.com/llms.txt
> Use this file to discover all available pages before exploring further.
# Pivot Report
> Create and customize campaign-specific reports using the Pivot Report feature in Pingtree.
The **Pivot Report** feature in Pingtree (PT) allows **organization owners** to create and save fully customizable reports based on campaign performance, traffic sources, devices, geography, and more.
By default, the system loads a **Default Report**, but owners can generate personalized dashboards with filters, metrics, and summaries that match their specific goals.
 ***
## Overview
With Pivot Reports, you can:
* View **real-time campaign activity**
* Customize columns and filters
* Choose from multiple field types (system, custom, device, geo)
* Save, load, and export tailored reports
***
## Key Features
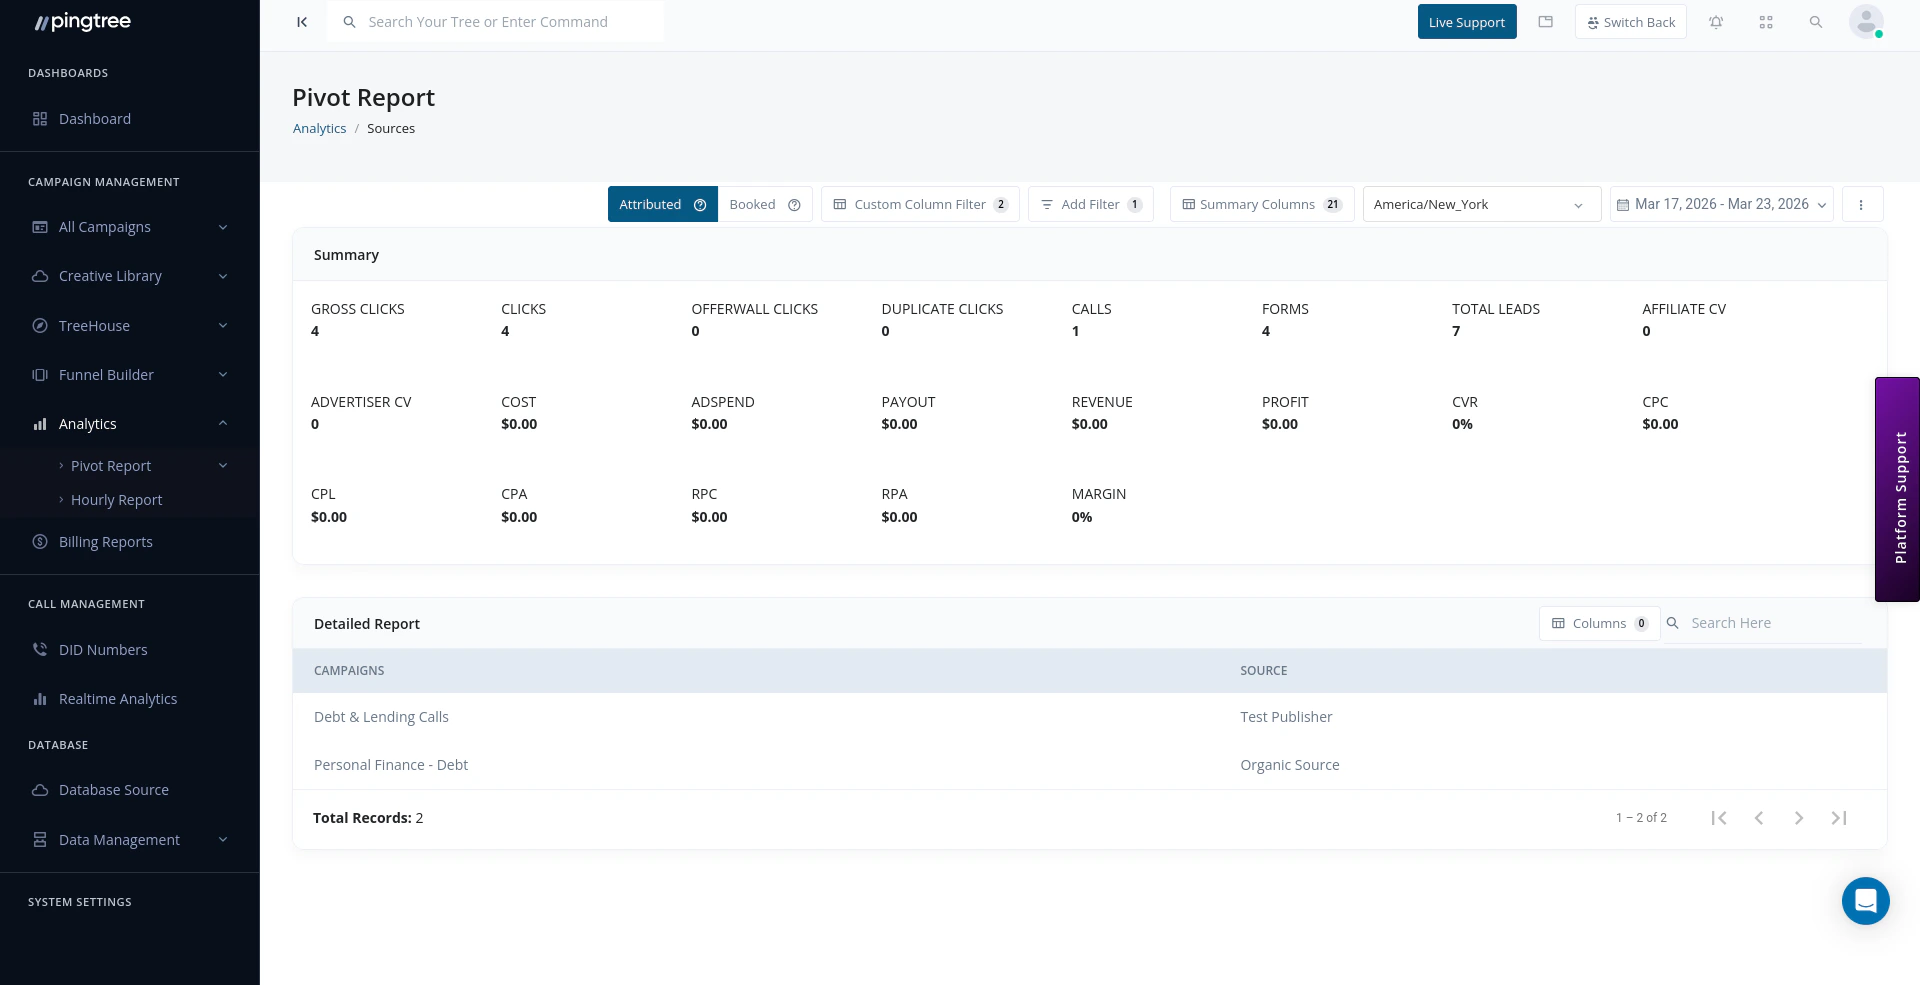
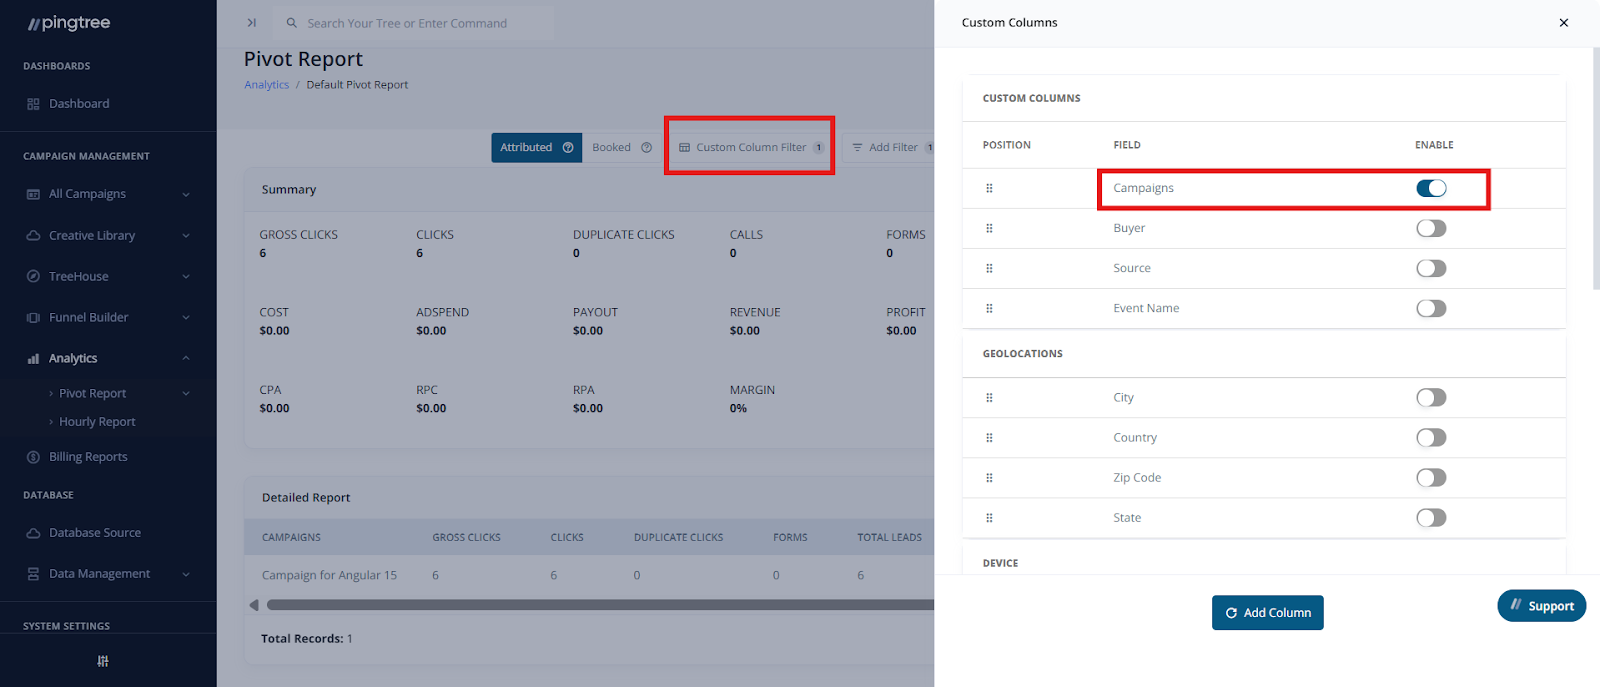
### Create Pivot Report
* Navigate to **Analytics > Pivot Report**.
* Use the **Custom Column Filter** dropdown to enable:
* **Campaigns**
* **Custom Sources**
* **Marketing Partners**
* **Media Channels**
* **Advertisers**
* **Custom Endpoints**
* **Parent Labels**
* **Media Types**
You can also enable/disable toggle buttons per requirement to generate highly focused reports.
***
## Overview
With Pivot Reports, you can:
* View **real-time campaign activity**
* Customize columns and filters
* Choose from multiple field types (system, custom, device, geo)
* Save, load, and export tailored reports
***
## Key Features
### Create Pivot Report
* Navigate to **Analytics > Pivot Report**.
* Use the **Custom Column Filter** dropdown to enable:
* **Campaigns**
* **Custom Sources**
* **Marketing Partners**
* **Media Channels**
* **Advertisers**
* **Custom Endpoints**
* **Parent Labels**
* **Media Types**
You can also enable/disable toggle buttons per requirement to generate highly focused reports.
 ***
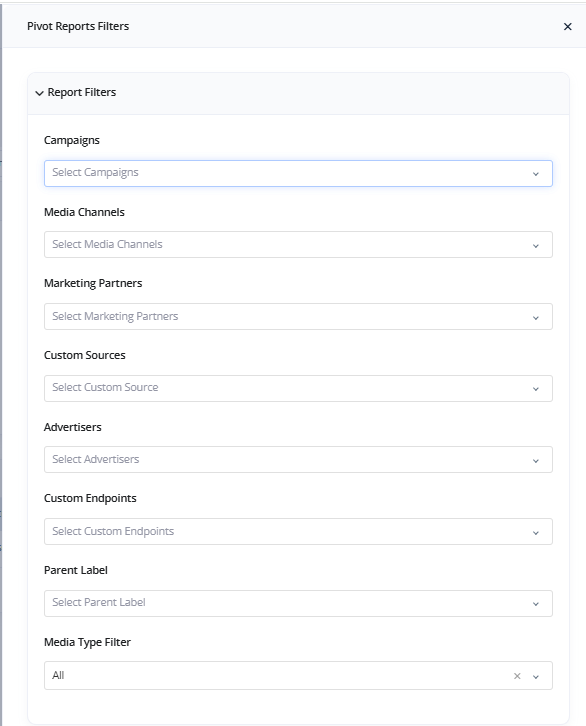
### Add Filter Dropdown
Use the **Add Filter** dropdown to refine your data:
* Target specific **campaigns or sources**
* Apply **metric-level conditions**
* Segment by **device**, **geolocation**, or **custom fields**
***
### Add Filter Dropdown
Use the **Add Filter** dropdown to refine your data:
* Target specific **campaigns or sources**
* Apply **metric-level conditions**
* Segment by **device**, **geolocation**, or **custom fields**
 ***
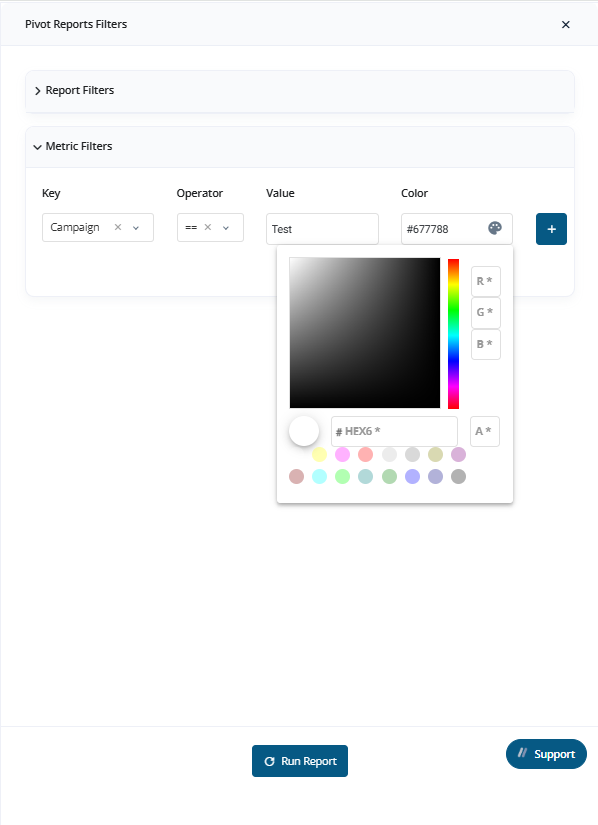
### Use Metric Filters and Color Highlights
You can use **color indicators** to visually represent data points in the Pivot Report for better analysis and pattern recognition.
***
### Use Metric Filters and Color Highlights
You can use **color indicators** to visually represent data points in the Pivot Report for better analysis and pattern recognition.
 ***
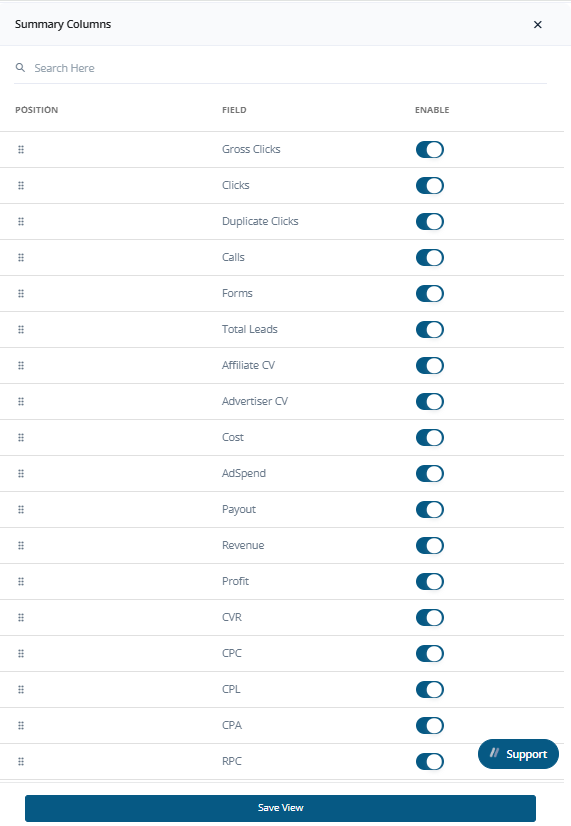
### Summary Columns Section
Choose which **Summary Columns** (e.g., total leads, accepted leads, profit, margin) to include using the Summary section selector.
***
### Summary Columns Section
Choose which **Summary Columns** (e.g., total leads, accepted leads, profit, margin) to include using the Summary section selector.
 ***
### Timezone & Date Range
* Select a **Timezone** using the dropdown
* Define a **Time Interval** using the **Date Picker**
***
### Timezone & Date Range
* Select a **Timezone** using the dropdown
* Define a **Time Interval** using the **Date Picker**
 ***
## Save, Load, and Export Reports
***
## Save, Load, and Export Reports
 ### Save a Report
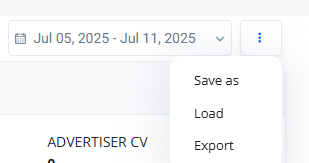
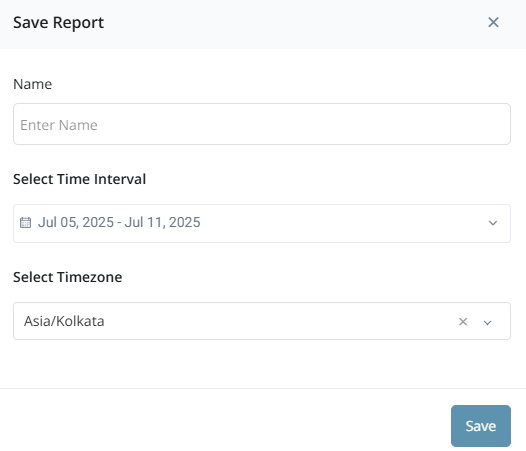
1. Click the **three-dot menu** (next to Date Picker)
2. Select **Save As**
3. Enter a **name** for your report
> *Timezone and time interval are pre-filled by default*
Saved reports are stored in:\
**Analytics > Pivot Report**
### Save a Report
1. Click the **three-dot menu** (next to Date Picker)
2. Select **Save As**
3. Enter a **name** for your report
> *Timezone and time interval are pre-filled by default*
Saved reports are stored in:\
**Analytics > Pivot Report**
 ***
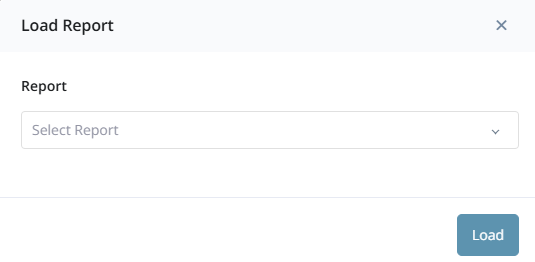
### Load a Saved Report
1. Click the **three-dot menu**
2. Select **Load**
3. Choose a saved report from the dropdown
You can also directly access saved reports via the **Pivot Report list view**.
***
### Load a Saved Report
1. Click the **three-dot menu**
2. Select **Load**
3. Choose a saved report from the dropdown
You can also directly access saved reports via the **Pivot Report list view**.
 ***
### Export a Report
1. Click the **three-dot menu**
2. Select **Export**
3. Your report will be automatically downloaded as a file.
***
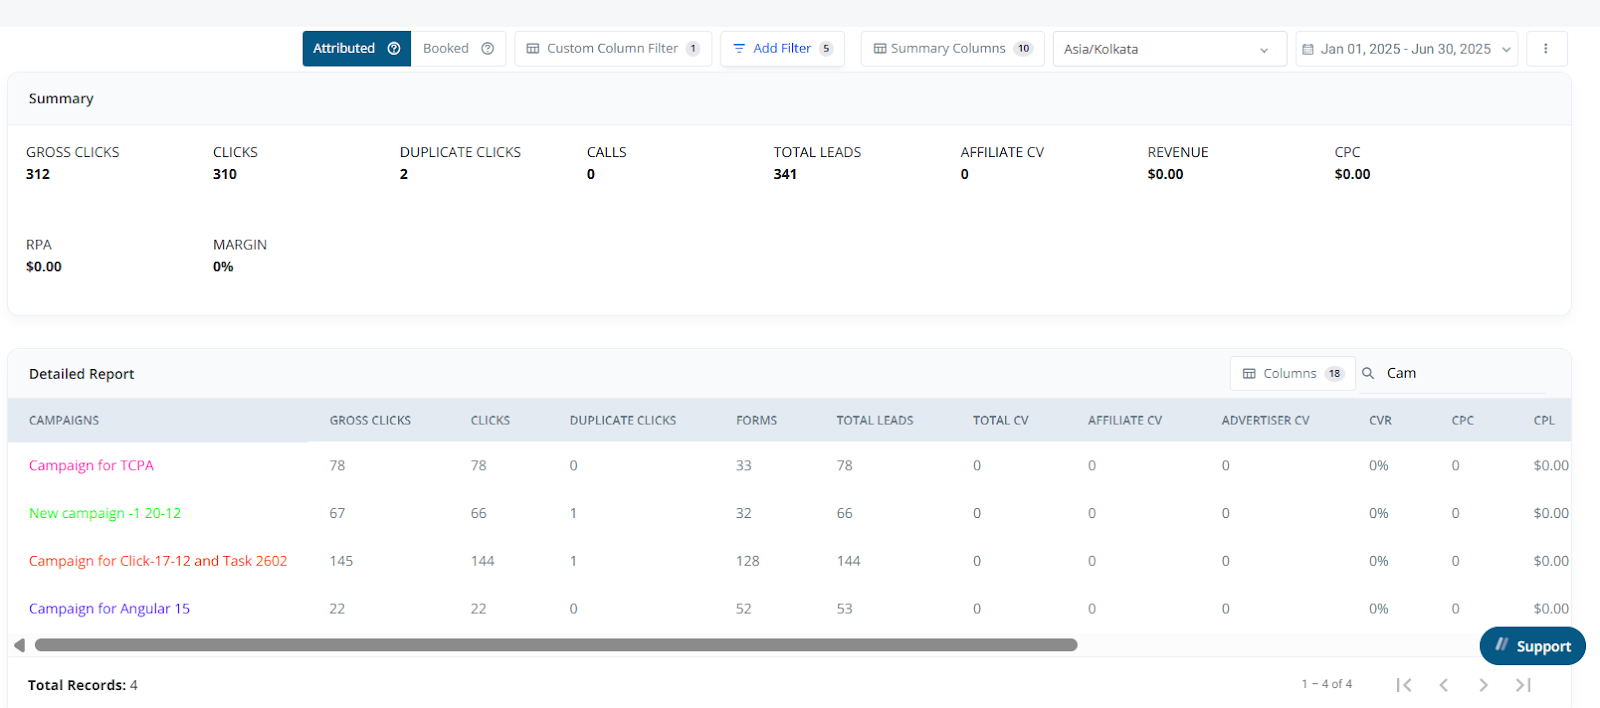
## Detailed Report View
Once a report is generated:
* A **Summary Section** appears at the top.
* Below that, you’ll see the **Detailed Data Table**.
* Click on **Columns Popup** to show/hide custom columns and tailor the report to your analysis needs.
***
### Export a Report
1. Click the **three-dot menu**
2. Select **Export**
3. Your report will be automatically downloaded as a file.
***
## Detailed Report View
Once a report is generated:
* A **Summary Section** appears at the top.
* Below that, you’ll see the **Detailed Data Table**.
* Click on **Columns Popup** to show/hide custom columns and tailor the report to your analysis needs.
 ***
## Use Case Examples
* Compare **performance across campaigns** and **traffic types**
* Highlight **high-converting sources** using color filters
* Track **daily lead submissions by state or device**
* View performance breakdowns by **Media Channels or Partners**
***
## Use Case Examples
* Compare **performance across campaigns** and **traffic types**
* Highlight **high-converting sources** using color filters
* Track **daily lead submissions by state or device**
* View performance breakdowns by **Media Channels or Partners**