> ## Documentation Index
> Fetch the complete documentation index at: https://docs.pingtree.com/llms.txt
> Use this file to discover all available pages before exploring further.
# Campaign Financial Overview
> Detailed financial reporting for a campaign including revenue, cost, profit, and buyer-level breakdowns.
## Overview
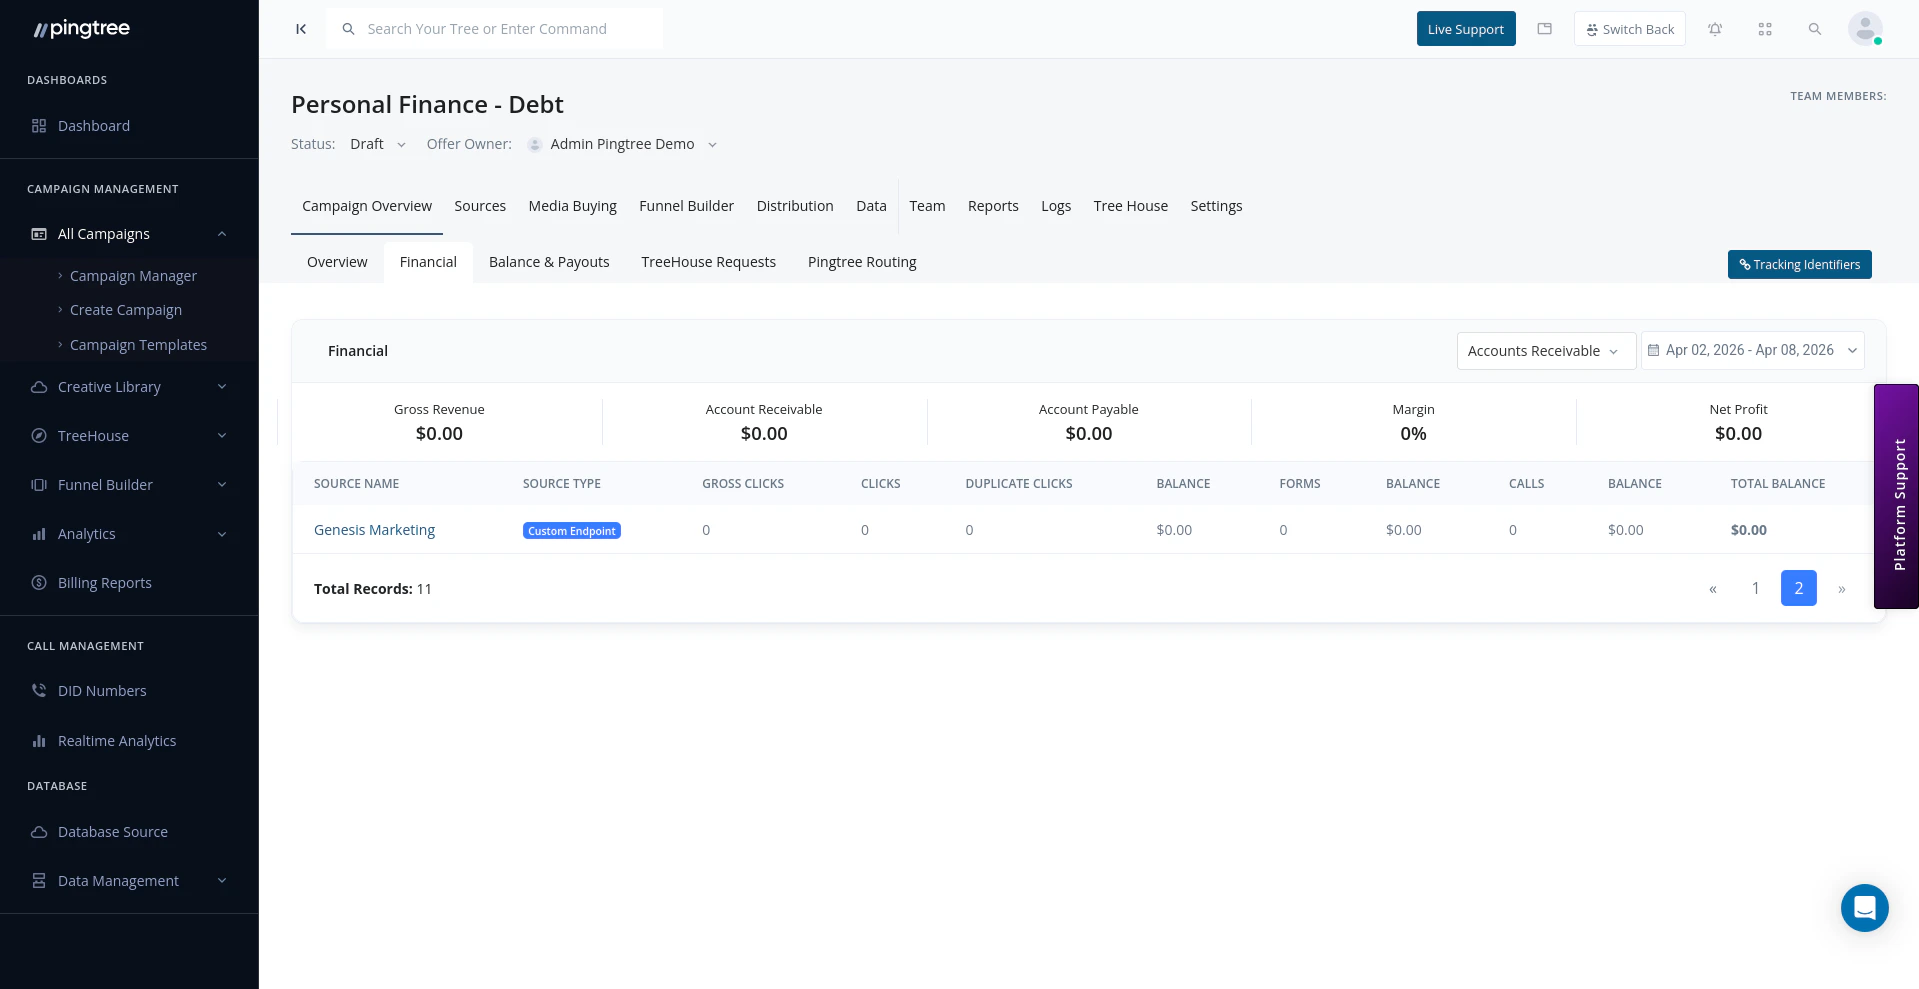
The **Campaign Financial Overview** gives you a comprehensive view of the money flowing through your campaign. It breaks down revenue, costs, and profit across time periods, sources, and buyers — so you always know where your margins stand and where to focus optimization efforts.
 ***
## Balance Report
The balance report provides a high-level summary of your campaign's financial position over the selected date range:
| Metric | Description |
| ----------------- | -------------------------------------------------- |
| **Total Revenue** | Sum of all revenue earned from sold leads |
| **Total Cost** | Sum of all costs attributed to traffic acquisition |
| **Profit** | Total Revenue minus Total Cost |
| **Profit Margin** | Profit as a percentage of Total Revenue |
Use the date range selector to view these figures for any custom period — daily, weekly, monthly, or a custom window.
> **Tip:** Switch to a monthly view at the end of each month to quickly reconcile your campaign P\&L without needing to export data.
***
## Time-Series Balance Report
Below the summary cards, a **graph view** plots revenue, cost, and profit over time. This lets you:
* Identify trends and seasonal patterns in your campaign performance
* Spot days or weeks where costs spiked without a matching revenue lift
* Compare performance across multiple time periods visually
The graph can be toggled between:
* **Daily** — Each data point represents one day
* **Weekly** — Data is aggregated by week
* **Monthly** — Data is aggregated by month
***
## Distribution Overview (Buyer-Level Breakdown)
The distribution section breaks financial performance down by individual buyers (distribution endpoints):
| Column | Description |
| ------------------- | ------------------------------------------- |
| **Buyer Name** | The name of the endpoint or advertiser |
| **Leads Delivered** | Total number of leads sent to this buyer |
| **Revenue** | Revenue earned from this buyer |
| **Cost** | Cost attributed to leads sent to this buyer |
| **Profit** | Revenue minus Cost for this buyer |
| **Margin** | Profit margin percentage for this buyer |
Use this view to identify which buyers are your most profitable and which ones may need renegotiated rates or additional filters.
***
## Source-Wise Financial Breakdown
The source-level breakdown shows how each traffic source contributes to your campaign's financials:
| Column | Description |
| ------------------- | ------------------------------------------------- |
| **Source Name** | Name of the source (CS, MP, or MC) |
| **Source ID** | Unique identifier (e.g., `cs101`, `mp55`, `mc12`) |
| **Leads Generated** | Total leads from this source |
| **Revenue** | Revenue attributed to this source |
| **Cost** | Cost for this source's traffic |
| **Profit** | Net earnings from this source |
This view is useful for identifying high-cost, low-conversion sources that may be dragging down overall campaign profitability.
***
## Profit Margin Tracking
Pingtree tracks profit margin at the campaign level, buyer level, and source level simultaneously. This lets you:
* Identify thin-margin buyers and renegotiate prices
* Spot high-cost sources and reduce spend or optimize targeting
* Monitor overall campaign health with a single percentage figure
***
## Exporting Financial Data
You can export any financial report as a **CSV file** for use in spreadsheets, accounting tools, or external reporting:
1. Apply your desired date range and filters.
2. Click the **Export** button in the top-right of the financial section.
3. The export will be generated and delivered via in-app notification and email.
> **Note:** CSV exports include all columns currently visible in the table. Customize your column selection before exporting to get exactly the data you need.
***
## Best Practices
* Review the time-series graph weekly to catch margin compression early.
* Use the buyer-level breakdown to prioritize your highest-margin distribution endpoints.
* Export monthly financials to keep a historical record outside of Pingtree for accounting purposes.
***
## Balance Report
The balance report provides a high-level summary of your campaign's financial position over the selected date range:
| Metric | Description |
| ----------------- | -------------------------------------------------- |
| **Total Revenue** | Sum of all revenue earned from sold leads |
| **Total Cost** | Sum of all costs attributed to traffic acquisition |
| **Profit** | Total Revenue minus Total Cost |
| **Profit Margin** | Profit as a percentage of Total Revenue |
Use the date range selector to view these figures for any custom period — daily, weekly, monthly, or a custom window.
> **Tip:** Switch to a monthly view at the end of each month to quickly reconcile your campaign P\&L without needing to export data.
***
## Time-Series Balance Report
Below the summary cards, a **graph view** plots revenue, cost, and profit over time. This lets you:
* Identify trends and seasonal patterns in your campaign performance
* Spot days or weeks where costs spiked without a matching revenue lift
* Compare performance across multiple time periods visually
The graph can be toggled between:
* **Daily** — Each data point represents one day
* **Weekly** — Data is aggregated by week
* **Monthly** — Data is aggregated by month
***
## Distribution Overview (Buyer-Level Breakdown)
The distribution section breaks financial performance down by individual buyers (distribution endpoints):
| Column | Description |
| ------------------- | ------------------------------------------- |
| **Buyer Name** | The name of the endpoint or advertiser |
| **Leads Delivered** | Total number of leads sent to this buyer |
| **Revenue** | Revenue earned from this buyer |
| **Cost** | Cost attributed to leads sent to this buyer |
| **Profit** | Revenue minus Cost for this buyer |
| **Margin** | Profit margin percentage for this buyer |
Use this view to identify which buyers are your most profitable and which ones may need renegotiated rates or additional filters.
***
## Source-Wise Financial Breakdown
The source-level breakdown shows how each traffic source contributes to your campaign's financials:
| Column | Description |
| ------------------- | ------------------------------------------------- |
| **Source Name** | Name of the source (CS, MP, or MC) |
| **Source ID** | Unique identifier (e.g., `cs101`, `mp55`, `mc12`) |
| **Leads Generated** | Total leads from this source |
| **Revenue** | Revenue attributed to this source |
| **Cost** | Cost for this source's traffic |
| **Profit** | Net earnings from this source |
This view is useful for identifying high-cost, low-conversion sources that may be dragging down overall campaign profitability.
***
## Profit Margin Tracking
Pingtree tracks profit margin at the campaign level, buyer level, and source level simultaneously. This lets you:
* Identify thin-margin buyers and renegotiate prices
* Spot high-cost sources and reduce spend or optimize targeting
* Monitor overall campaign health with a single percentage figure
***
## Exporting Financial Data
You can export any financial report as a **CSV file** for use in spreadsheets, accounting tools, or external reporting:
1. Apply your desired date range and filters.
2. Click the **Export** button in the top-right of the financial section.
3. The export will be generated and delivered via in-app notification and email.
> **Note:** CSV exports include all columns currently visible in the table. Customize your column selection before exporting to get exactly the data you need.
***
## Best Practices
* Review the time-series graph weekly to catch margin compression early.
* Use the buyer-level breakdown to prioritize your highest-margin distribution endpoints.
* Export monthly financials to keep a historical record outside of Pingtree for accounting purposes.