Overview
With Pivot Reports, you can:- View real-time campaign activity
- Customize columns and filters
- Choose from multiple field types (system, custom, device, geo)
- Save, load, and export tailored reports
Key Features
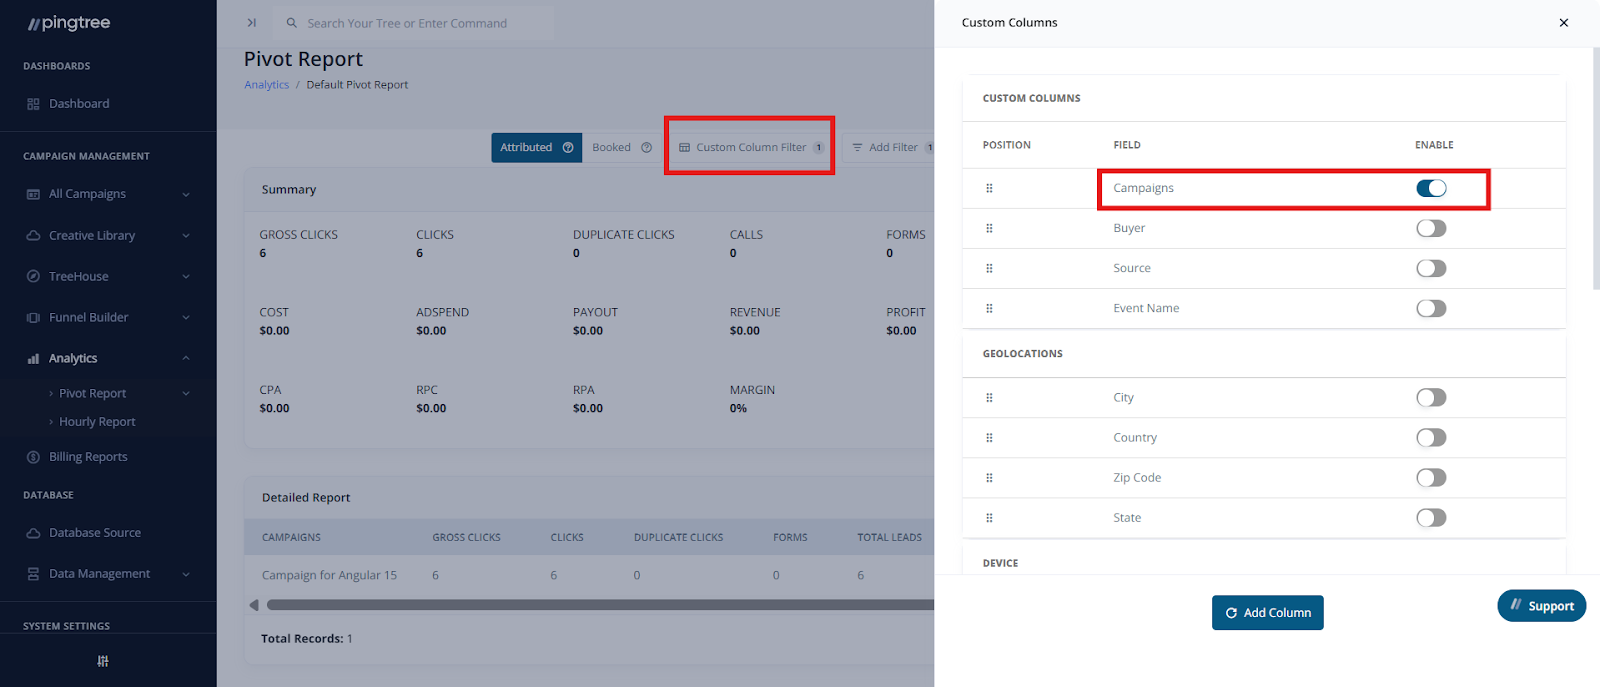
Create Pivot Report
- Navigate to Analytics > Pivot Report.
- Use the Custom Column Filter dropdown to enable:
- Campaigns
- Custom Sources
- Marketing Partners
- Media Channels
- Advertisers
- Custom Endpoints
- Parent Labels
- Media Types
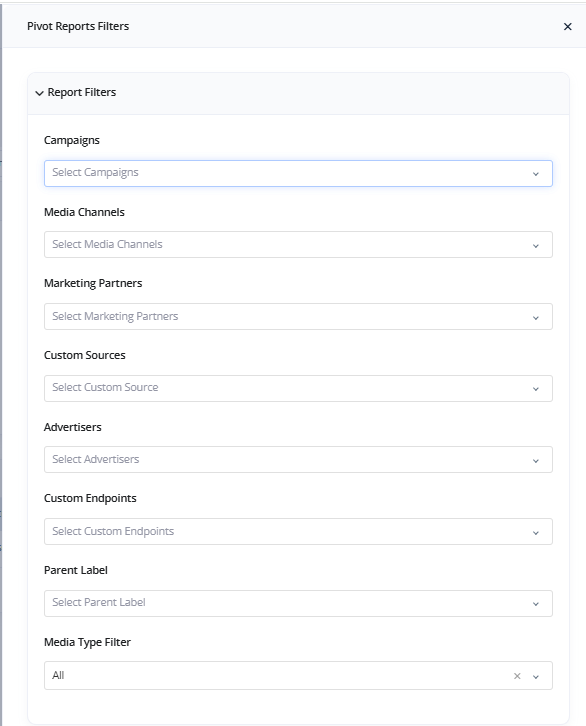
Add Filter Dropdown
Use the Add Filter dropdown to refine your data:- Target specific campaigns or sources
- Apply metric-level conditions
- Segment by device, geolocation, or custom fields
Use Metric Filters and Color Highlights
You can use color indicators to visually represent data points in the Pivot Report for better analysis and pattern recognition.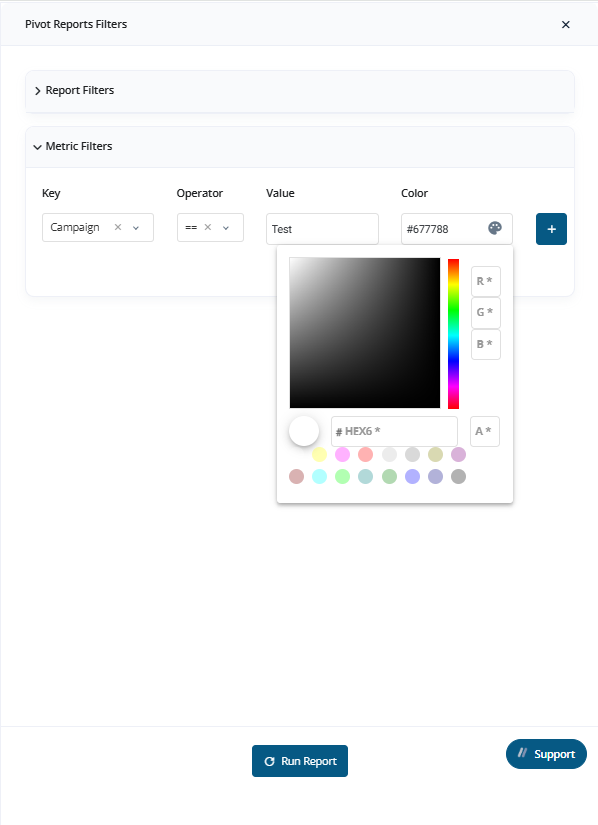
Summary Columns Section
Choose which Summary Columns (e.g., total leads, accepted leads, profit, margin) to include using the Summary section selector.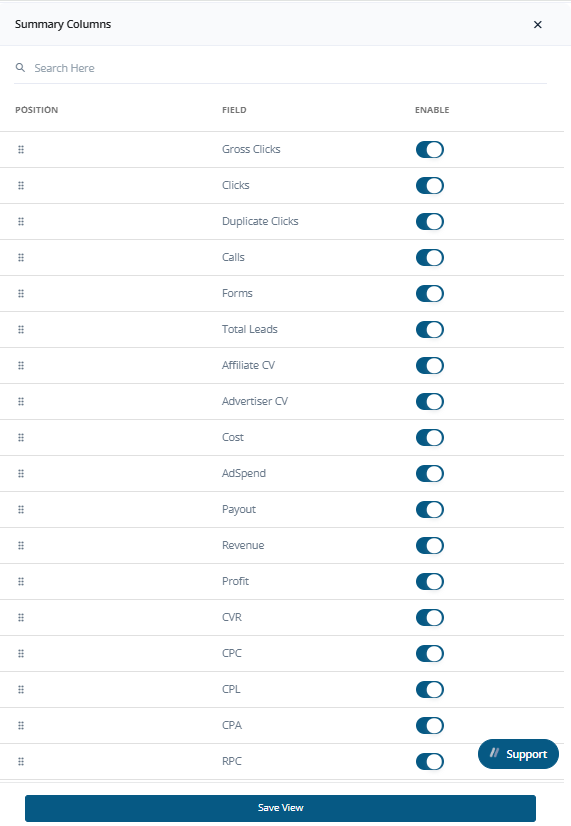
Timezone & Date Range
- Select a Timezone using the dropdown
- Define a Time Interval using the Date Picker

Save, Load, and Export Reports
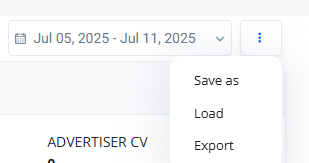
Save a Report
- Click the three-dot menu (next to Date Picker)
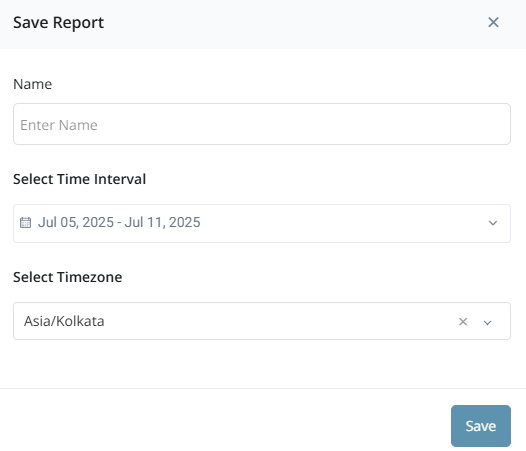
- Select Save As
- Enter a name for your report
Timezone and time interval are pre-filled by default
Analytics > Pivot Report
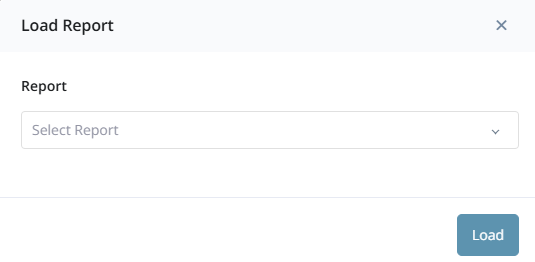
Load a Saved Report
- Click the three-dot menu
- Select Load
- Choose a saved report from the dropdown
Export a Report
- Click the three-dot menu
- Select Export
- Your report will be automatically downloaded as a file.
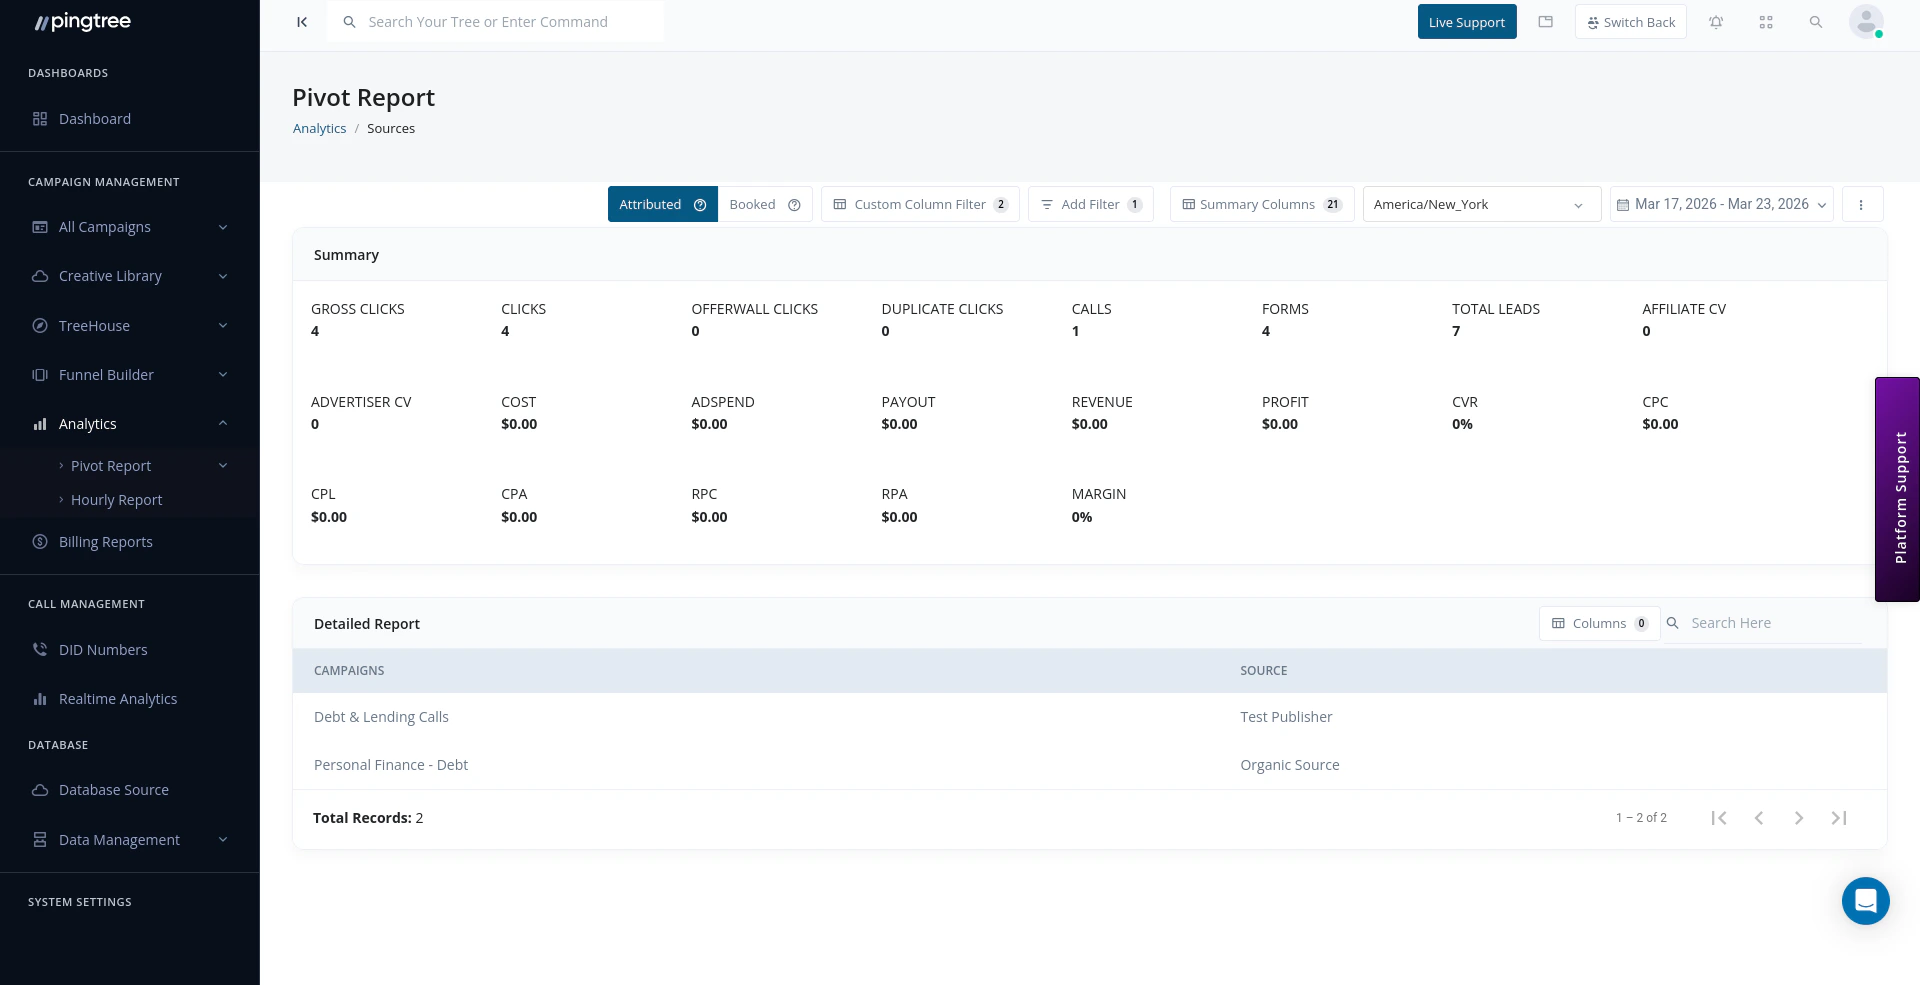
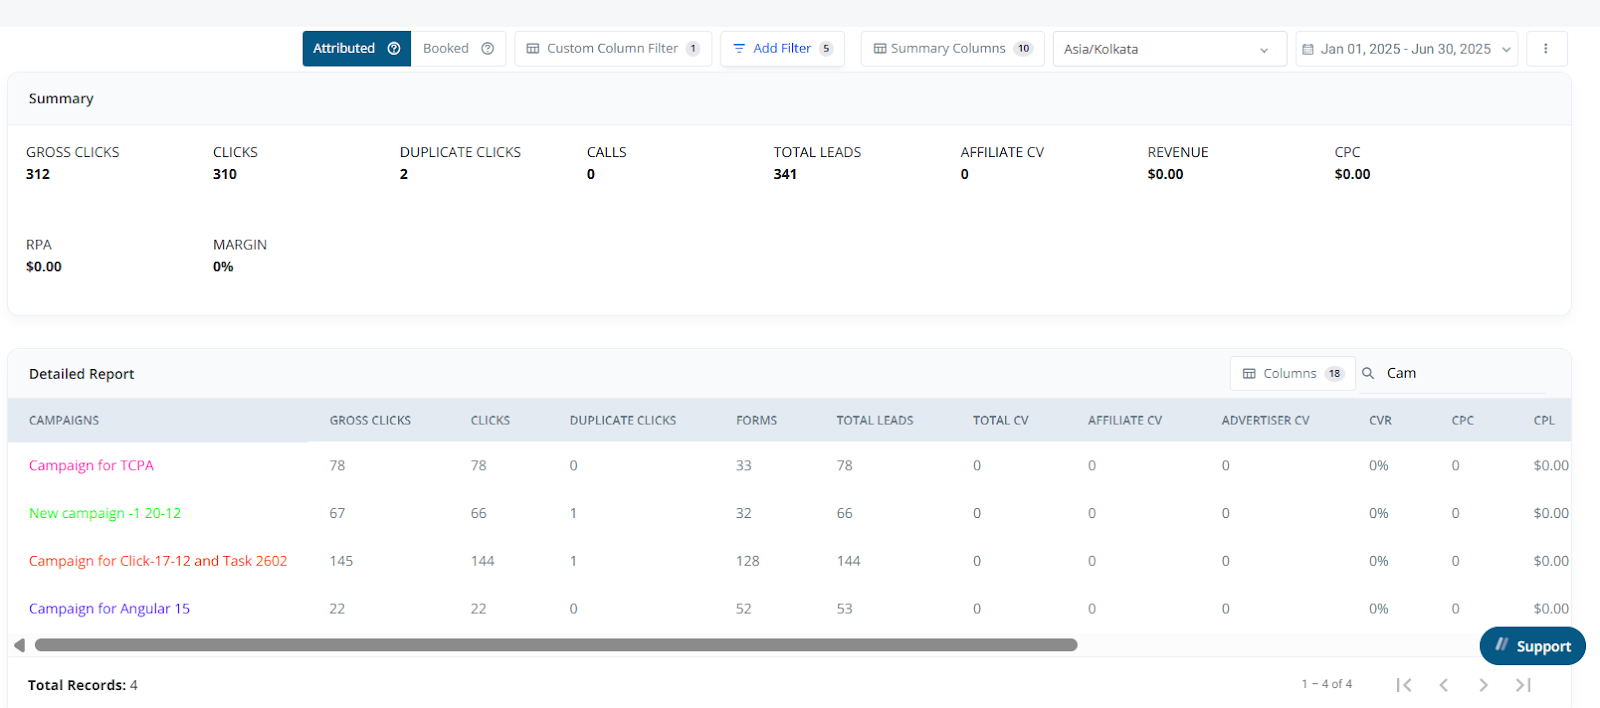
Detailed Report View
Once a report is generated:- A Summary Section appears at the top.
- Below that, you’ll see the Detailed Data Table.
- Click on Columns Popup to show/hide custom columns and tailor the report to your analysis needs.
Use Case Examples
- Compare performance across campaigns and traffic types
- Highlight high-converting sources using color filters
- Track daily lead submissions by state or device
- View performance breakdowns by Media Channels or Partners