Overview
The Campaign Overview is the first page you see when you open a campaign. It gives you a live snapshot of how your campaign is performing — from top-level revenue and conversion metrics down to individual source traffic flows. Use this page to quickly assess campaign health, spot anomalies, and navigate to any area of the campaign that needs attention.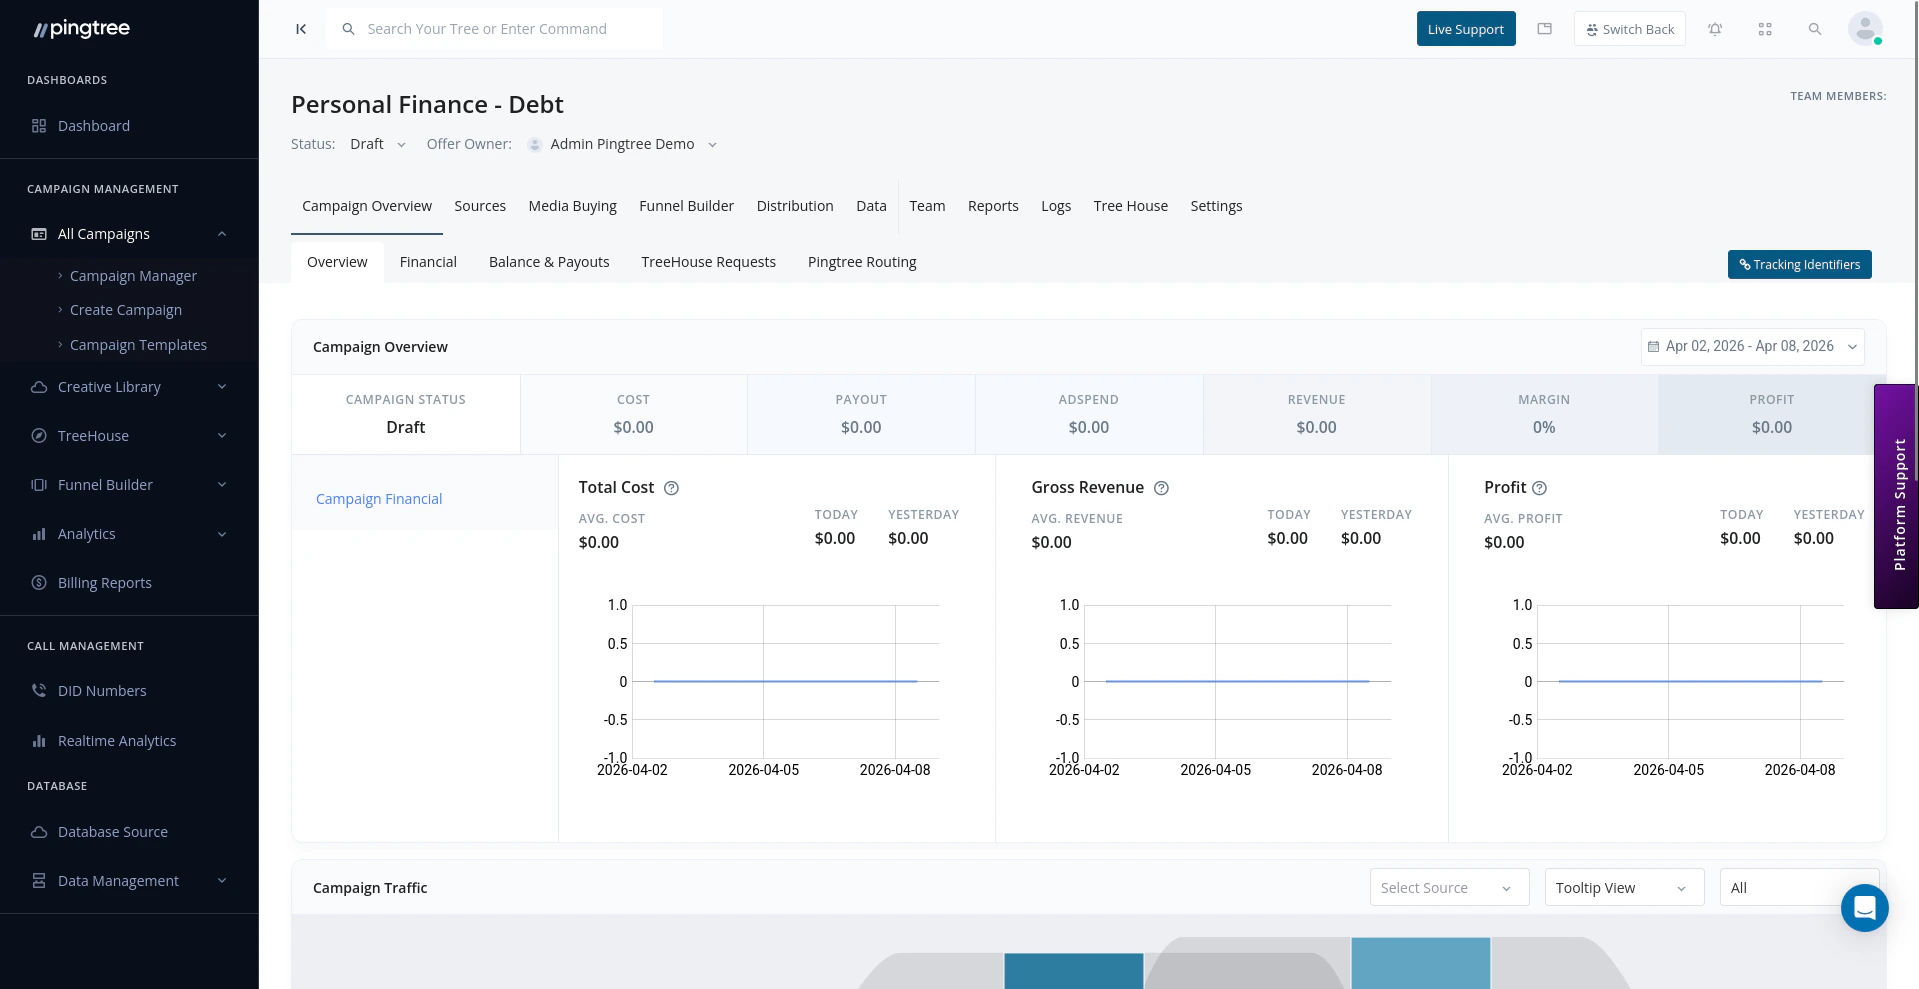
Campaign overview dashboard with real-time metrics and source flow visualization
Date Range Selector
All data on the overview dashboard is filtered by the selected date range. Use the date picker in the top-right to choose:- Presets: Today, Yesterday, Last 7 Days, Last 30 Days, This Month, Last Month
- Custom Range: Select any start and end date
Performance Metrics
The headline metrics section displays the most critical numbers at a glance:Key Performance Ratios
Below the headline metrics, you’ll find calculated ratios that help you evaluate efficiency:Tip: A widening gap between CPL and RPC is an early warning sign that your traffic costs are outpacing revenue. Use these ratios daily to catch issues before they compound.
Source Flow Visualization
The Source Flow section shows a visual diagram of how traffic enters and moves through your campaign:- Each source (CS, MP, or MC) is shown as a node.
- Arrows indicate traffic flowing from source to distribution endpoints.
- Click any node to drill into that source or endpoint’s performance.
Traffic Analysis by Source Type
The traffic breakdown table segments performance by source type:
Each source type row shows clicks, conversions, revenue, cost, and margin, giving you an at-a-glance read on which traffic tier is performing best.
Quick Navigation Links
The overview includes quick links to jump to key campaign sections:- Campaign Settings — Configure timezone, dedupe, domains, and integrations
- Reports — Access transaction, conversion, and buyer reports
- Distribution — Manage routing logic and endpoints
- Sources — Add or configure traffic sources
- Funnel Builder — Edit landing pages and form flows