The Real-Time Call Analytics dashboard gives you an up-to-the-second view of inbound call performance. It is designed for call center operations where knowing what is happening right now — not ten minutes ago — is critical for managing quality and capacity.
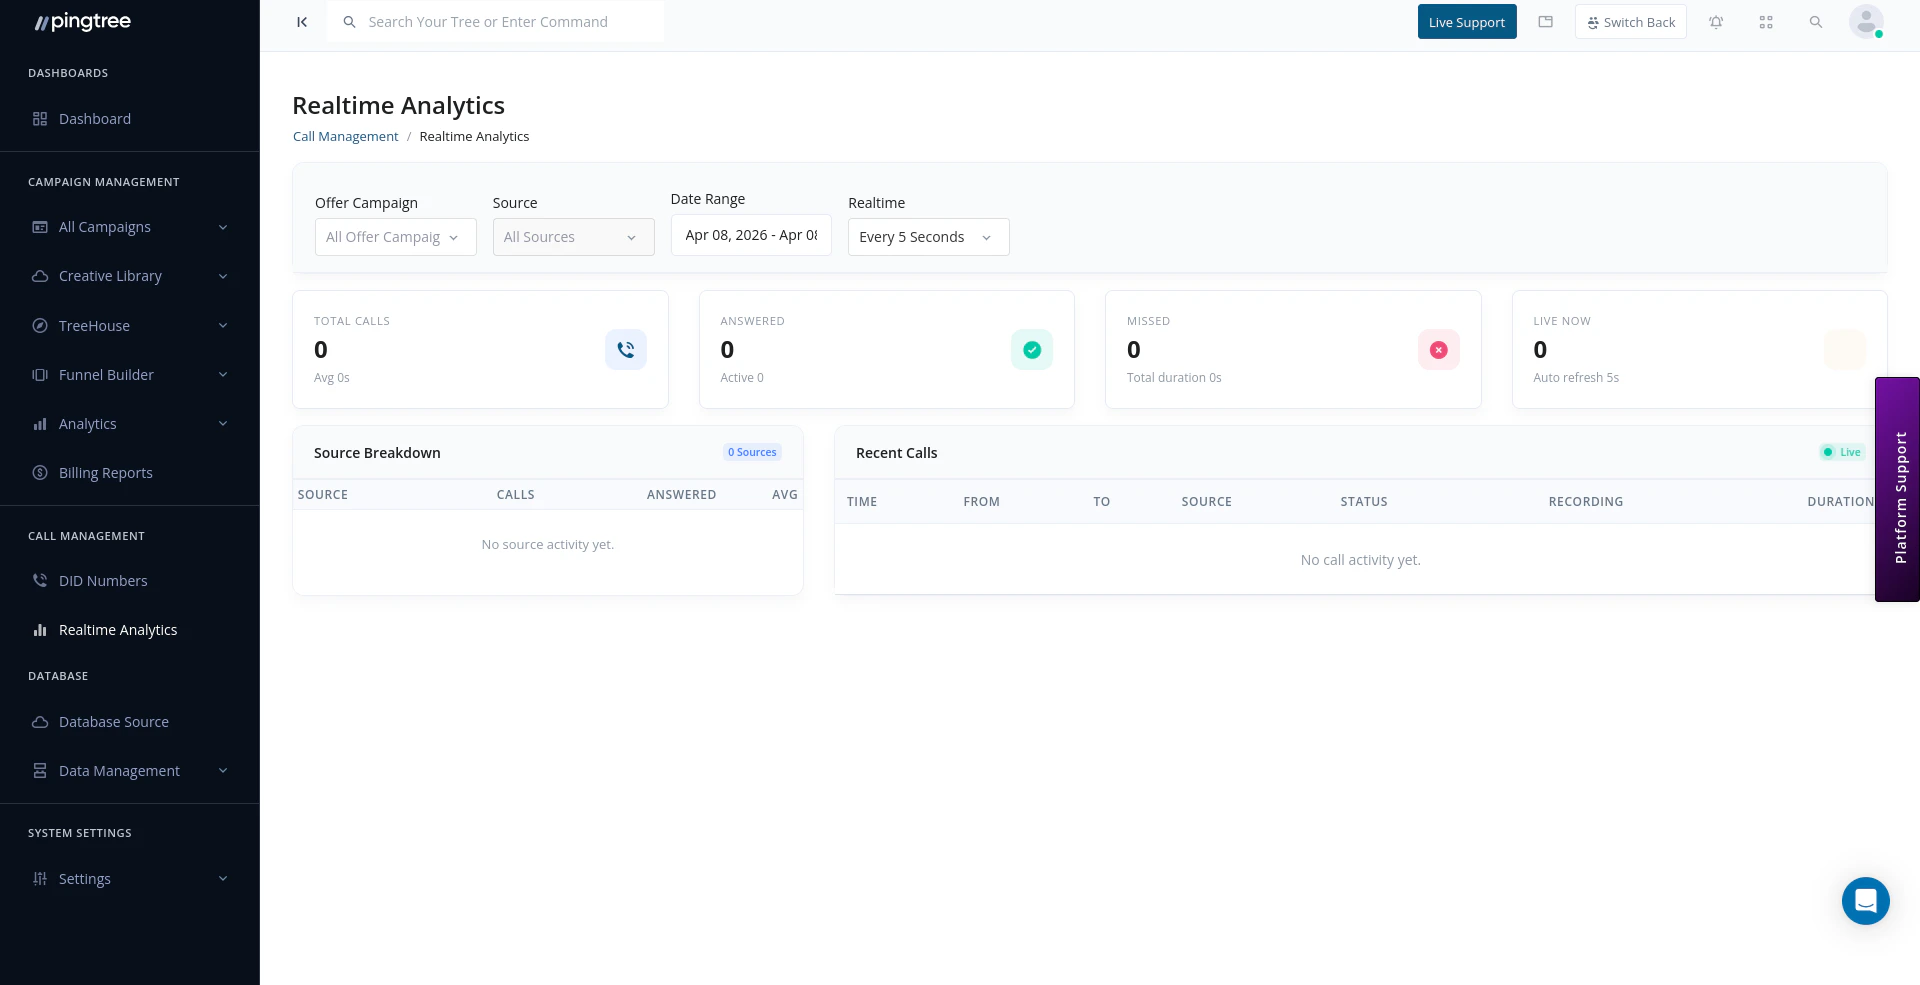
Real-time call analytics dashboard with live metrics

Dashboard Overview

The dashboard is organized into three sections:
  1. Summary metrics — headline numbers for the selected date range and filters.
  2. Source breakdown — per-source call performance for the active campaign.
  3. Recent calls — a live feed of the most recent 25 calls with status and duration.

Summary Metrics

MetricDescription
Total CallsAll inbound calls that arrived in the selected time window
Answered CallsCalls that were successfully connected to a buyer
Missed CallsCalls that were not answered (no buyer available or caller hung up)
Active CallsCalls currently in progress at the time of the last refresh
Total DurationCumulative talk time for all answered calls
Average DurationMean call length across answered calls
A call’s status is determined in real time:
  • If callEndedAt is not set, the call is Live (active).
  • If the call ended and isCallAnswered is true, it is Answered.
  • If the call ended and isCallAnswered is false, it is Missed.

Filtering

Use the filters at the top of the dashboard to narrow analytics to a specific slice of traffic:
FilterEffect
CampaignLimits metrics to a single offer campaign
SourceFurther narrows to one source within the selected campaign
Date RangeDefaults to Today; supports all standard relative and absolute date ranges
Changing any filter immediately triggers a fresh data fetch and resets the polling timer.
Tip: Select a specific source when monitoring a call center team’s dedicated line. This isolates that source’s performance from the rest of the campaign’s traffic.

Auto-Refresh (Real-Time Polling)

The dashboard polls for new data automatically. Choose your refresh interval from the Auto Refresh dropdown:
OptionInterval
OffNo automatic refresh
Every 3 Seconds3,000 ms
Every 5 Seconds5,000 ms (default)
Every 10 Seconds10,000 ms
Polling is paused automatically when you open a call recording playback modal and resumes when the modal is closed. This prevents data from refreshing underneath an open recording. The last updated timestamp in the toolbar shows exactly when the most recent data fetch completed.
Tip: Use Every 3 Seconds during peak hours or live campaigns where response time matters. Switch to Every 10 Seconds or Off during off-peak review sessions to reduce unnecessary network activity.

Recent Calls Feed

The recent calls table shows the last 25 calls matching your current filters. Each row displays:
  • From — the caller’s phone number
  • To — the DID number that was dialed
  • Status — Live, Answered, or Missed (color-coded badge)
  • Duration — formatted as hours, minutes, and seconds (e.g., 2m 14s)
  • Started At — the timestamp the call began
The feed updates automatically with each polling cycle so new calls appear without a manual refresh.

Use Cases

Monitor Call Quality During a Live Campaign

Set the auto-refresh interval to every 3 or 5 seconds. Watch the Answered vs. Missed ratio in real time. A rising Missed count may signal that buyer capacity needs to be increased or that routing rules need adjustment.

Track Agent Performance

Filter by a source tied to a specific agent or call center team. Compare their Answered Calls, Total Duration, and Average Duration against expectations.

Identify Routing Issues Quickly

If Active Calls is high but Answered Calls is not increasing, calls may be stuck in routing. Check buyer availability and routing rules in the campaign distribution settings.

Capacity Planning

Use Total Duration and Average Duration to estimate how many buyers or agents are needed for a given call volume. If average duration is 4 minutes and you expect 60 calls per hour, you need at least four concurrent buyer lines to avoid missed calls.

Source Type Labels

Sources appear in the campaign and source dropdowns using their display names. The dashboard maps internal source type codes to readable labels:
Internal TypeDisplay Label
marketerMarketing Partner
customCustom Source
mediaMedia Channel