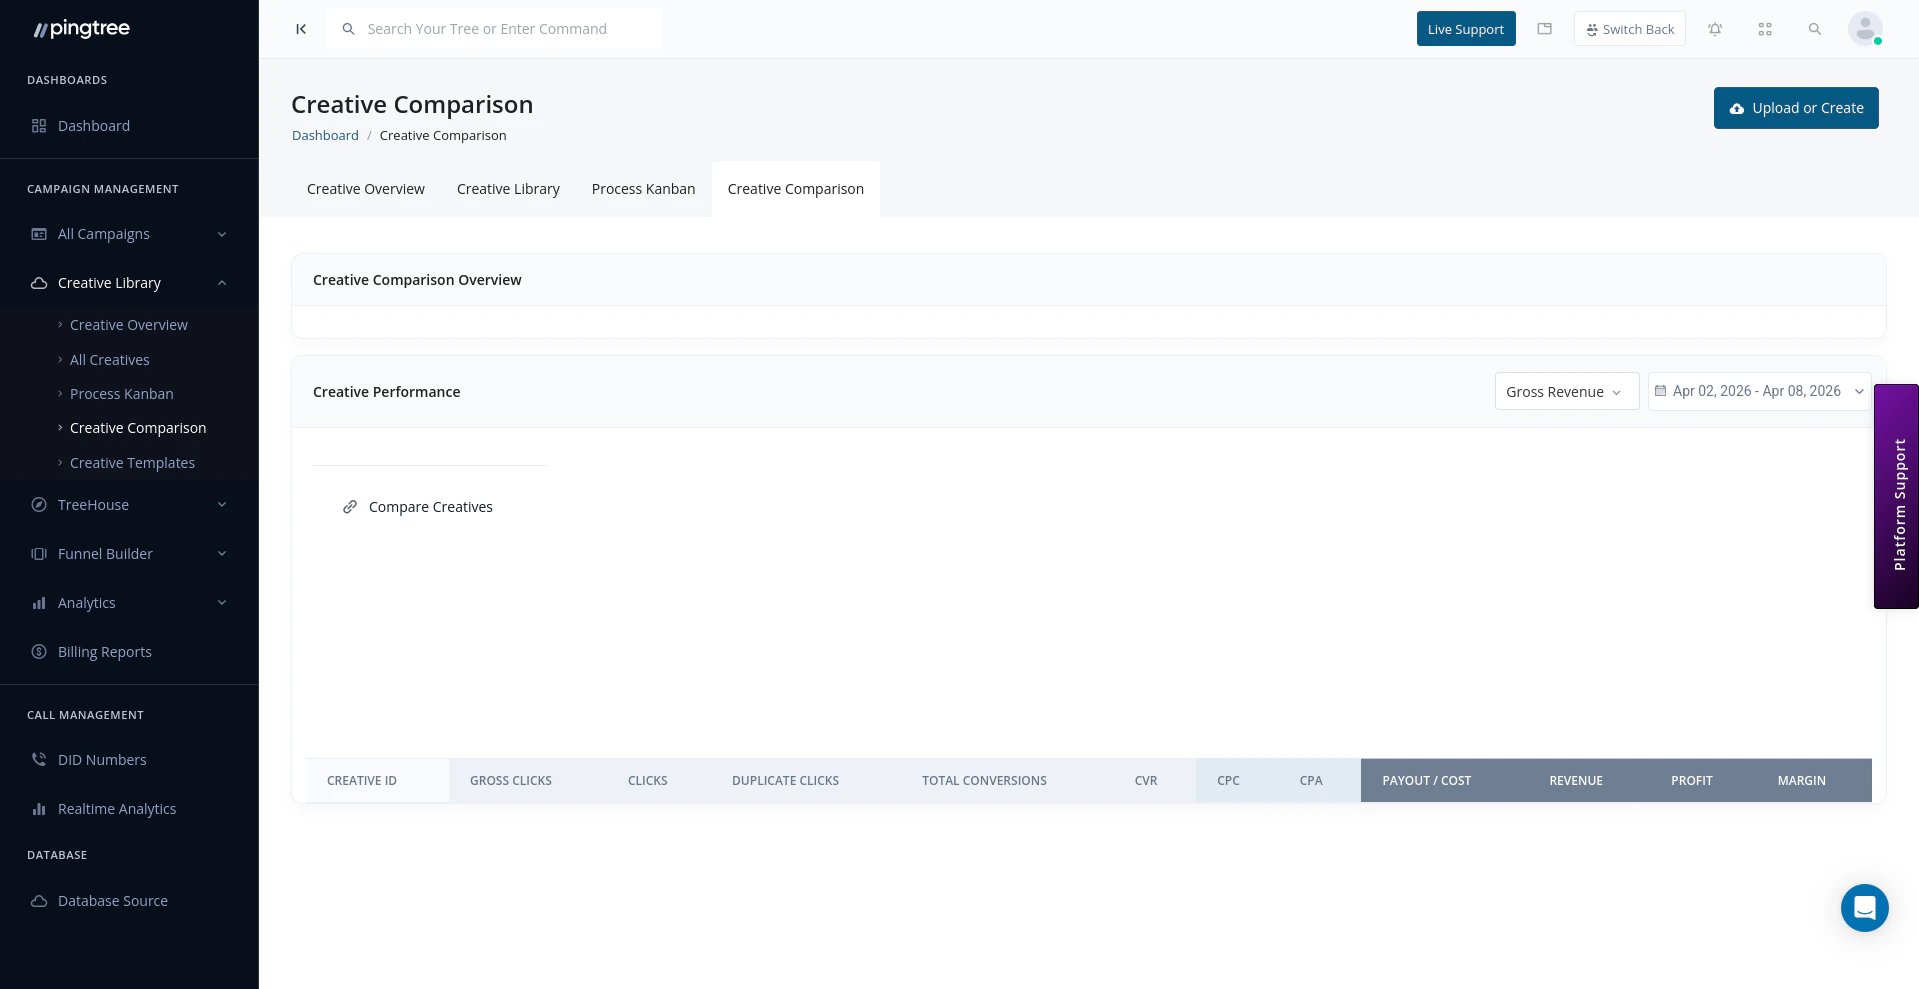
Creative Comparison page with performance metrics and compare creatives link
Selecting Creatives to Compare
You can initiate a comparison from two places:- From the Creative Library — select the checkboxes on two or more creative cards, then click Compare Selected.
- From the Comparison page directly — use the creative picker to search and add creatives by name or ID.
Side-by-Side Performance Metrics
Once creatives are selected, their metrics are displayed in aligned columns so you can compare values directly.
Metrics that are significantly higher or lower than the group average are highlighted automatically, so top and bottom performers are immediately visible.
Comparing Across Campaigns and Sources
By default, comparison metrics are aggregated across all campaigns and sources the creative has been used in. You can narrow the scope using the filters at the top of the comparison view:
This is useful when a creative has been used across multiple campaigns and you want to evaluate its performance in one specific context rather than in aggregate.
Tip: If a creative performs well in one campaign but poorly in another, use the Campaign filter to isolate performance by context. The issue may be the audience or placement rather than the creative itself.
Selecting Creatives for A/B Testing
Once you have identified creatives you want to test against each other, you can designate them as an A/B test directly from the comparison view:- Select the creatives you want to test.
- Click Set as A/B Test.
- Assign the test to a campaign.
- Configure the traffic split (e.g., 50/50 or weighted).
- Save the test configuration.
Saving Comparison Selections
Comparison sets can be saved so you do not have to rebuild them from scratch each time you want to revisit a group of creatives.- Click Save Comparison and give the set a name (e.g., Q2 Banner Variants).
- Saved comparisons appear in the Saved Comparisons sidebar on the left of the page.
- Open a saved comparison at any time to reload the same creatives with fresh metrics for the current date range.
Tip: Save a comparison set after a creative review meeting so you can quickly pull it up in the next session and see how metrics have evolved since then.
Identifying Top Performers
The comparison view is particularly useful for evaluating similar creative variations — for example, the same ad copy with different imagery, or the same design in multiple sizes. Common use cases:Tip: Sort the comparison table by Conversion Rate rather than clicks alone — a creative with fewer clicks but a higher CVR is often more valuable than a high-click creative that fails to convert.