Key Features
- Metrics Summary: Aggregated totals for core performance metrics such as clicks, conversions, and revenue.
- Visual Charts: Easy-to-read graphs for identifying trends and comparing performance.
- Action History: A detailed table showing source-wise performance and campaign events.
Metrics Displayed
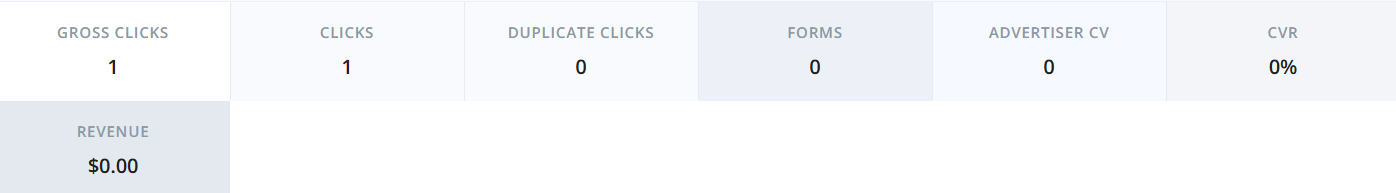
- Gross Clicks: Total number of raw clicks (including duplicates).
- Clicks: Unique clicks excluding duplicates.
- Duplicate Clicks: Clicks recognized as repeated or redundant.
- Form Submissions: Number of completed lead forms.
- Advertiser Conversions (CVs): Total confirmed conversion events from advertisers.
- Conversion Rate (CVR): Calculated as
(Conversions / Clicks) * 100. - Revenue: Total revenue generated from converted leads.
Charts and Visualizations
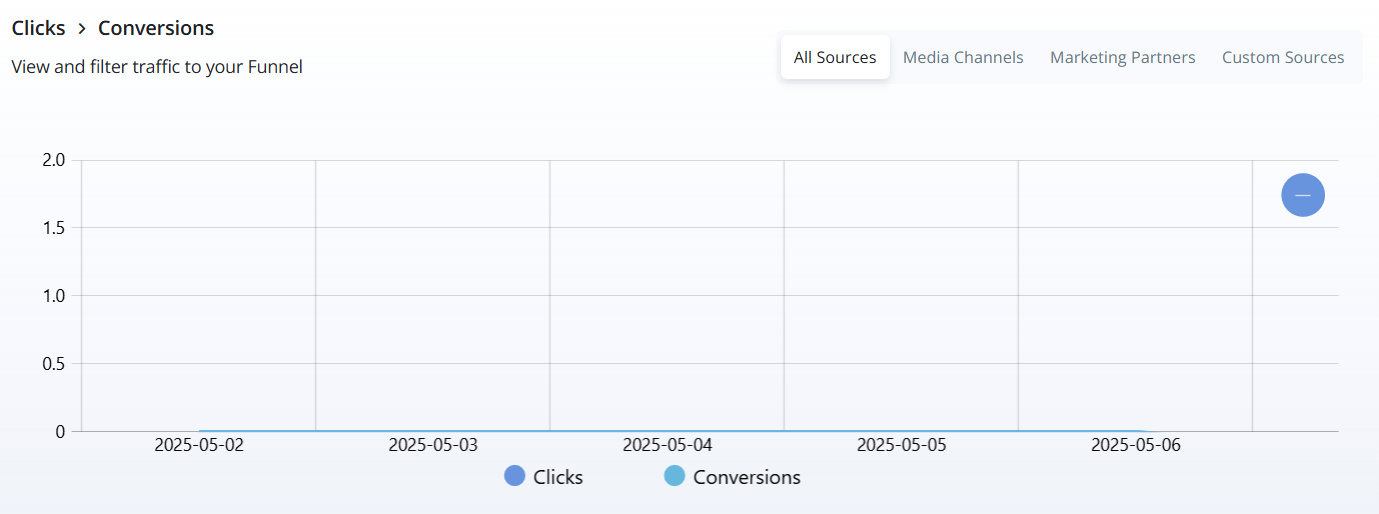
- Clicks vs Conversions (Line Chart): Compares the count of clicks vs conversions over time.
- Gross Clicks (Metric Card): Highlights total gross clicks in the selected period.
- Clicks (Metric Card): Shows the number of unique clicks.
- Advertiser Conversions (Metric Card): Displays confirmed conversions.
- Conversion Rate (Metric Card): Shows percentage of clicks that led to conversions.
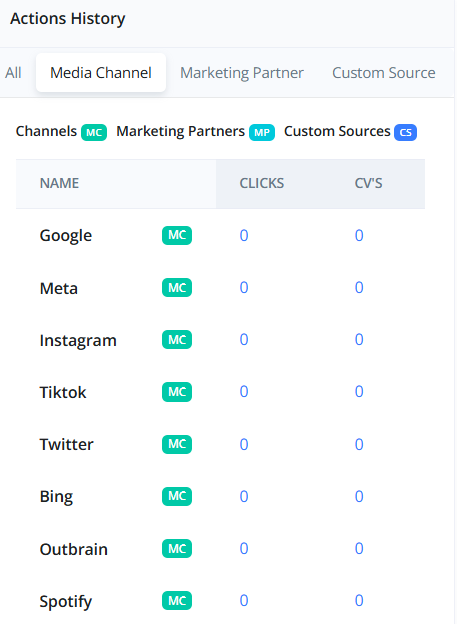
Action History
 The Action History table details the performance of individual traffic sources and recent campaign actions.
Each row includes:
The Action History table details the performance of individual traffic sources and recent campaign actions.
Each row includes:
- Source: The traffic source name or identifier.
- Clicks: Total clicks from that source.
- Conversions (CVs): Total confirmed conversions from that source.
Tip: Use this table to identify top-performing traffic sources and investigate any underperforming ones.