Core concepts
Using The Dashboard
The Pingtree dashbaord was designed to give you a complete 30,000 foot view of all campaign and performance metrics. This comprehensive view will provide the quickest ability to analyze and navigate the application.
Dashboard Performance Chart
The Dashboard Performance Chart allows for a quick and accurate assesment of all or a single campaign. This chart bridges campaign performance and the operations of a campaign into one complete view that will help assist in analyzing the relationship between performance and actions taken on the campaign.
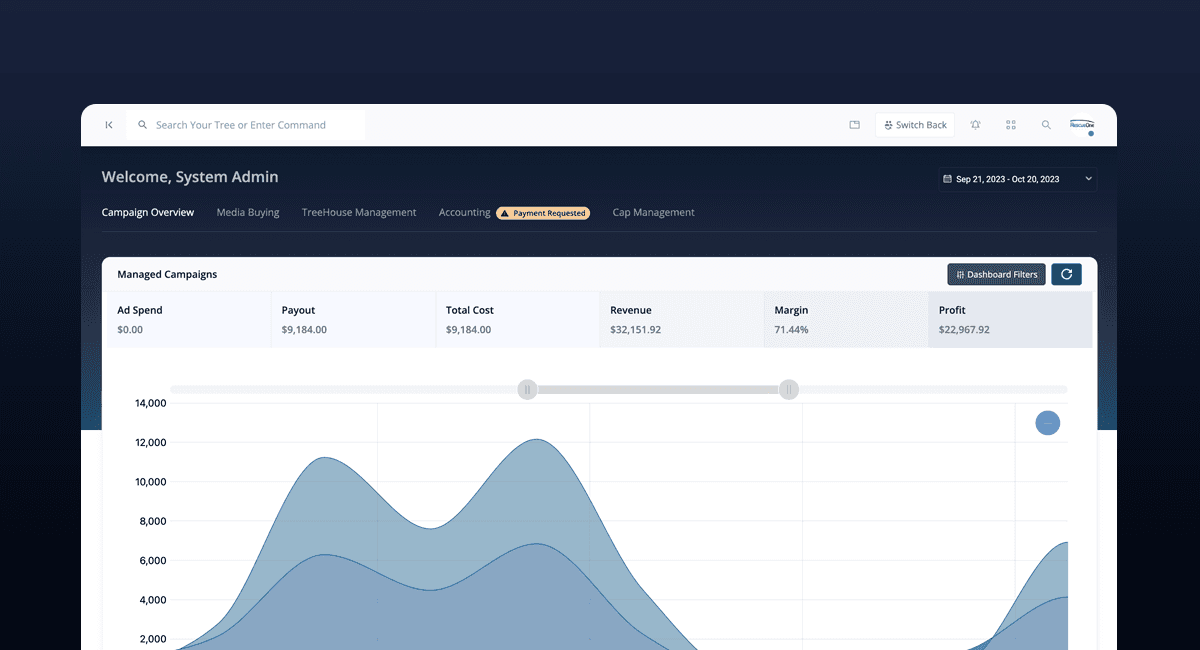
Chart Metrics
Chart Metrics This comprehensive and complete campaign will analyze and present layered data on key metrics that show histroic performance and material events that influenced the campaigns performance.
When using this chart the you will have the ability layer by:
- Selecting a campaign
- Selecting a metric
- Applying a date range
- Including indicators
Event Indicators
The chart will allow you to set Event Indicators that will allow the ability to set markers on the chart to indicate where changes, events and other material actions have taken place to the campaign. These indicators are meant to assit you in discovering what campaign changes are being made and the relationship between those actions and performance.
Event Indicator Types
Indicators are seperated by types for the user to pick and choose from several types of indicators and apply them at the same time to layer in cause / effect into the chart.
Sources - Partners & Custom Sources
| Icon | Description |
|---|---|
| This will indicate the Source Addition to the campaign | |
| Image | This will show when a Payout Value Decreased has occurred |
| Image | This will show when a Payout Value Increased has occurred |
| Image | This will show when a Cap Decrease has occurred |
| Image | This will show when a Cap Increase has occurred |
Endpoints - Distribution
| Icon | Description |
|---|---|
| Image | This will indicate the Endpoint Addition to the campaign |
| Image | This will show when a Cost Value Decresed has occurred |
| Image | This will show when a Cost Value Increased has occurred |
| Image | This will show when a Cap Decrease has occurred |
| Image | This will show when a Cap Increase has occurred |
| Image | This will show when a Reject Decrease has occured |
| Image | This will show when a Reject Increase has occurred |
Click Listing
| Icon | Description |
|---|---|
| Image | This will indicate the Listing Addition to the campaign |
| Image | This will show when a Listing Rank Increase has occured |
| Image | This will show when a Listing Rank Decrease has occured |
Media Channels
| Icon | Description |
|---|---|
| Image | This will indicate the Media Channel Addition to the campaign |
| Image | This will show when an Adspend Decresed has occured |
| Image | This will show when an Adspend Increased has occured |
Media Channels
| Icon | Description |
|---|---|
| Image | This will indicate the User Addition to the campaign |
| Image | This will show when a User Made A Change occur |
Metric and Event Relationship
The purpose of this is to set a visual of change that is outside external events and focus sqaurely on how your business is operationalized and making chnages and decisions - as these decisions will have the greatest impact on your campaign.
Quick Navigation Tiles
There are many locations in the application for a user to navigate to and operate the application. The quick tiles are supportive to you in that it will quickly navigate you to the core functionality. This is a dashboard convivence feature, similar to the application tabs.
Quick Links
Simply click on the quick links for quaick navigation to various modules in the application. These modules will set a session tab and allow you to tab back if needed.
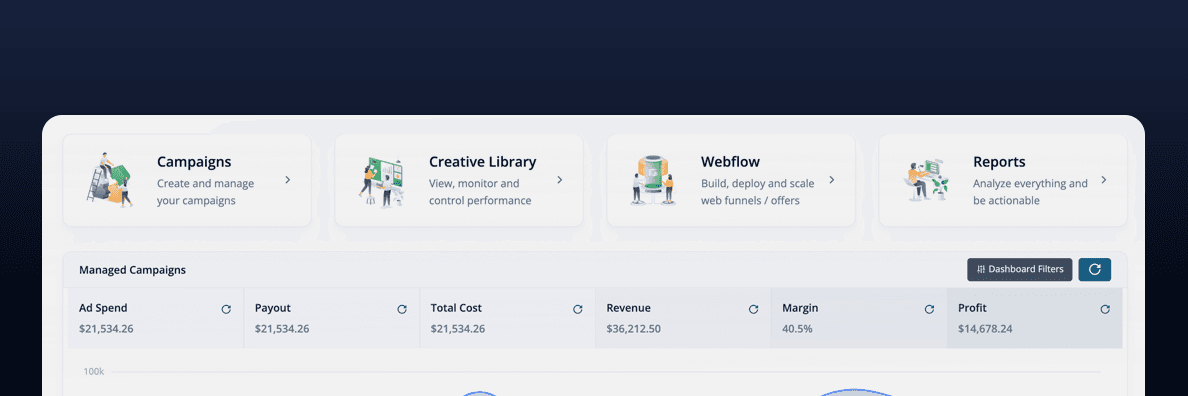
Campaign Overview & Financial Metrics
The Campaign Financial Metrics will show you the overall financial metrics and how the campaigns are doing as a whole. Using the dashboard filters you can add and filter this table. This table will have a card header that will show the base metrics:
The main chart will show campaings that have been selected in the dashboard filters slide out.
The lower portion of this card will show the listings of campaings in which you will have the ability to quickly naviagte and manage that particular campaign
Dashboard Filters
To open the dashboard filters click on the header of the card to slide open the options filter view. Here you will be able to select all the filters that will update the dashboard and charts / metrics.
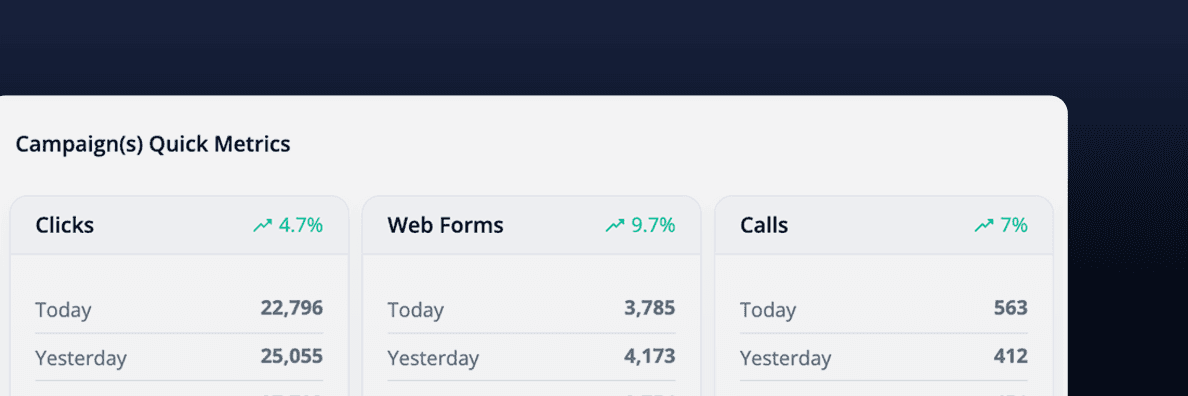
Quick Metrics
There are focused KPI / Metrics or data points that are most relevant to you. In your account, you can set preferences to see these metric cards and the data you want for quick review and analyzation.
Quick Metric Cards
You can add as many cards as you wish and add as many data points to them. These cards (once the view cannot support it) will scroll horizontally.
You will also have the ability to drag and drop them as to your preference and an order that makes sense to you.
Adjust Metric Cards
To adjust these cards you need to click on the right hand side Adjust Metric Cards and that will open up a metric card editor.
When the slide out appears you can enabled, sort and add to the cards shown. Simple edit and close and your card will now be updated.
Campaign Quick Performance
For those who will run many campaigns or seperate their marketing by type, vertical or other filter the campaign quick performance will show multiple campaigns to one view and display group stats on the footer.
Campaign Quick Performance Chart
This chart is to help you see the volume and metrics totalled across several different campaigns.
Changing Card Metrics
To change metric cards you need to click on the lower right where it is labeled Metrics and this will slide out the metric adjustment panel.
To adjust the metrics drag from the left to the right and the selected metric will now show on the dashboard.