Note: This tab is only available in Custom Source (CS) and Marketing Partner (MP) source types.The Overview tab in the Source Single View provides a detailed reporting dashboard for a specific source. While many configuration settings can be managed at the campaign level (impacting all traffic sources), the Overview tab offers granular insight and control over an individual source’s performance. This tab is especially useful for monitoring and comparing key metrics, allowing you to fine-tune your lead traffic strategies.
What’s Included
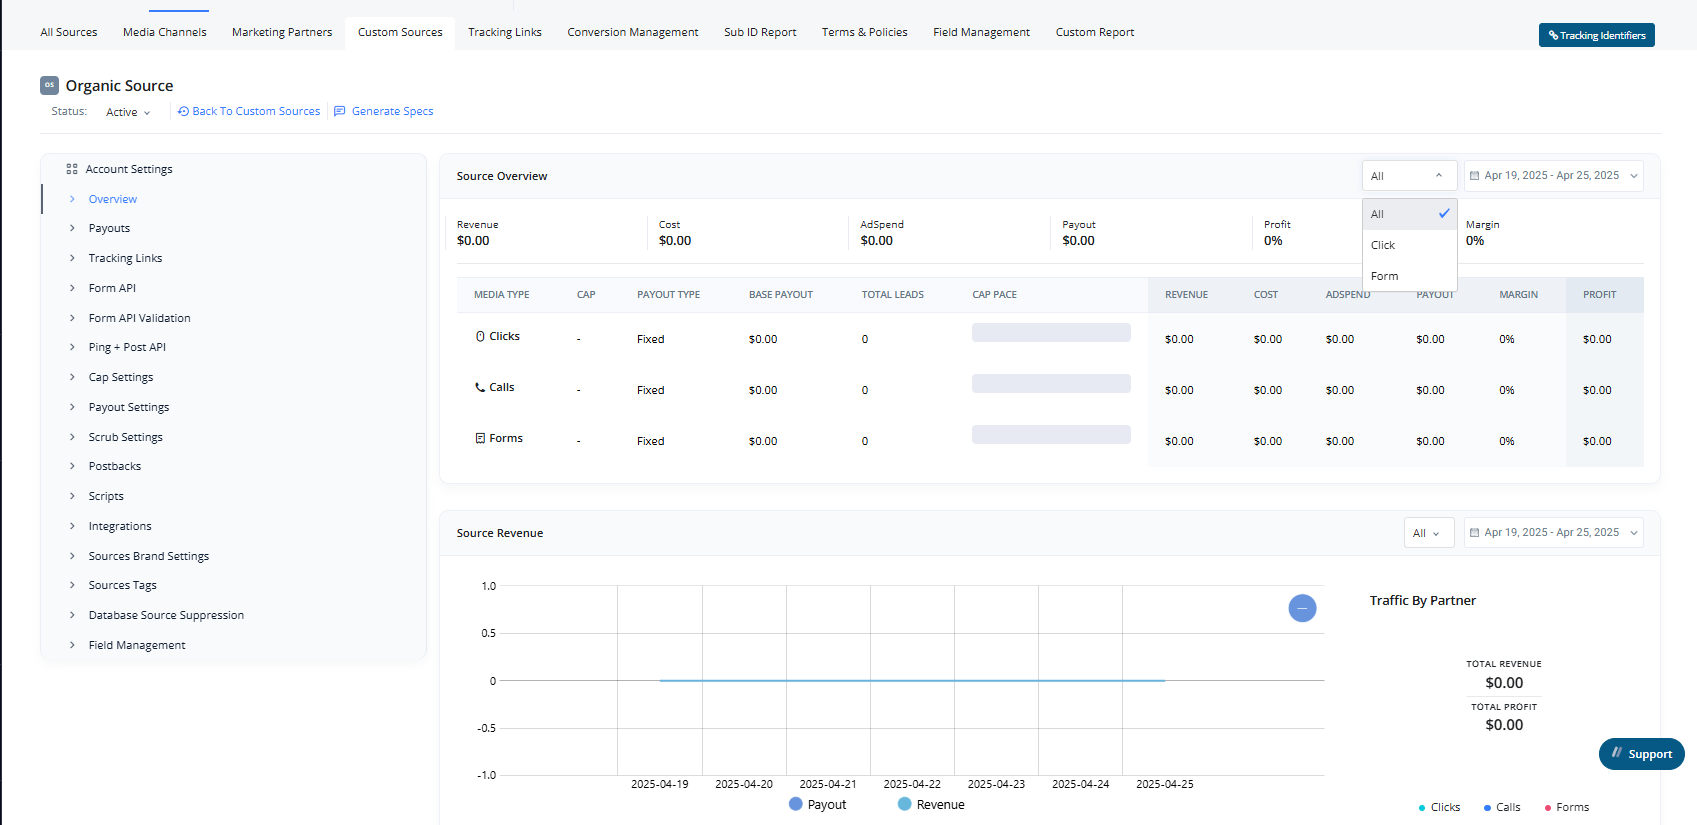
1. Source Overview
A summary of core performance metrics for the selected source, including:- Revenue
- Cost
- Ad Spend
- Payout
- Margin
- Profit
- Apply custom Date Ranges for analysis.
- Payout Type
- Cap Pace
2. Source Revenue
This report shows a line graph of the source’s Revenue and Payout, with the ability to:- Filter by traffic type: All, Click, Call, or Form
- Apply custom Date Ranges for analysis
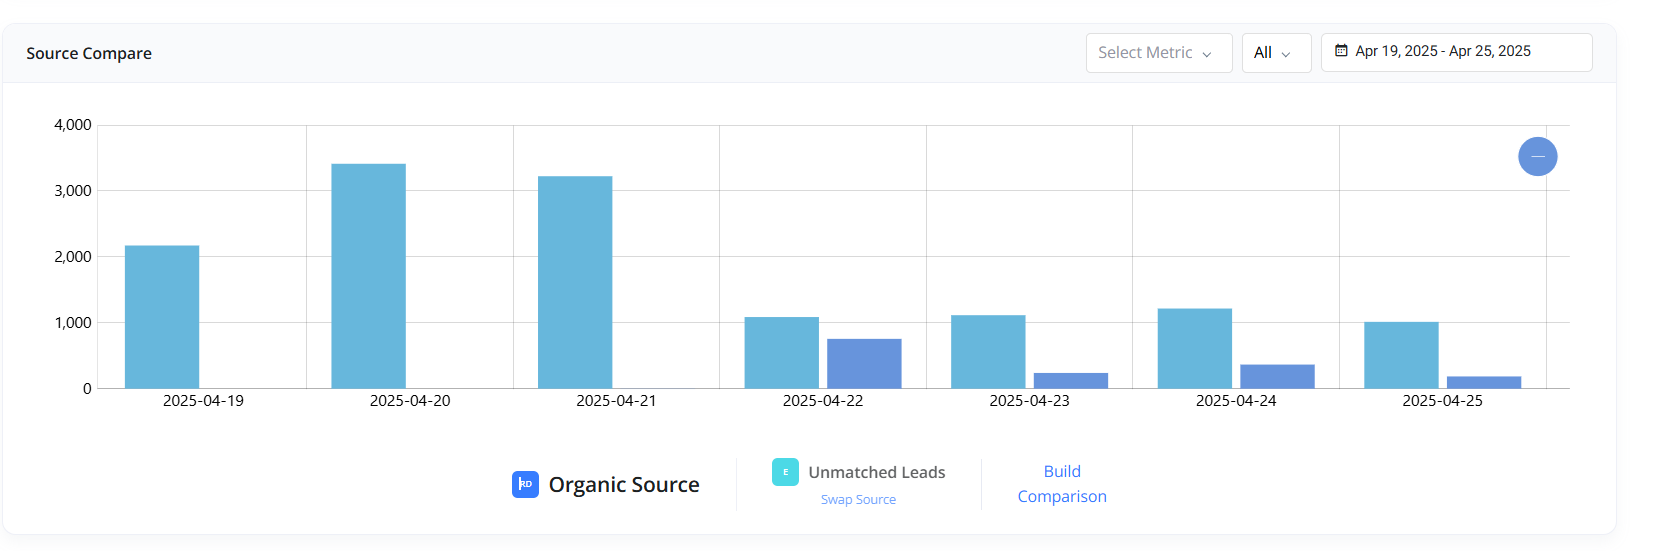
3. Source Compare
This section lets you:- Select and compare multiple other sources
- View a bar chart (daily breakdown)
- Toggle between metrics: Volume, Revenue, Profit, or Payout
- Apply custom Date Ranges for analysis